Technical analyst Clive Maund discusses the dollar's fall and what it means for gold.
We now have a very rare setup for gold which is in position to "go ballistic" as the dollar collapses. The dollar is being intentionally destroyed by the Fed, which is creating dollars in vast unprecedented quantities in order to buy up distressed assets on the cheap and in order to pave the way for the new "digital dollar." We are in the last stages of the fiat endgame where money creation goes vertical, quickly leading to it becoming worthless, as happened in Venezuela and Zimbabwe, and of course hyperinflation is a great way to pay off debt, because you can do so with worthless currency.
One worry that has been vexing would be investors in the precious metals sector in recent weeks is that gold and silver won't rise much because big banks like JP Morgan will cap it by dumping onto the paper market. The key point to keep in mind is that gold is "real money" and this being so the idea that a currency like the dollar can collapse towards zero and gold won't go up because the banks will be selling it on the paper market is both absurd and ridiculous – what would happen is that an untenable massive gap would develop between the price on the paper market and the price on the physical market, and the paper market would become rapidly irrelevant and obsolete, so we don't have to worry about that. In fact, to the extent that they are actually suppressing the gold price, all they are doing is creating a "pressure cooker" effect that will lead to a massive upside explosion, but you certainly don't want to wait for that to happen before you take positions across the sector.
Now let's proceed to look at gold's latest charts and various other related charts.
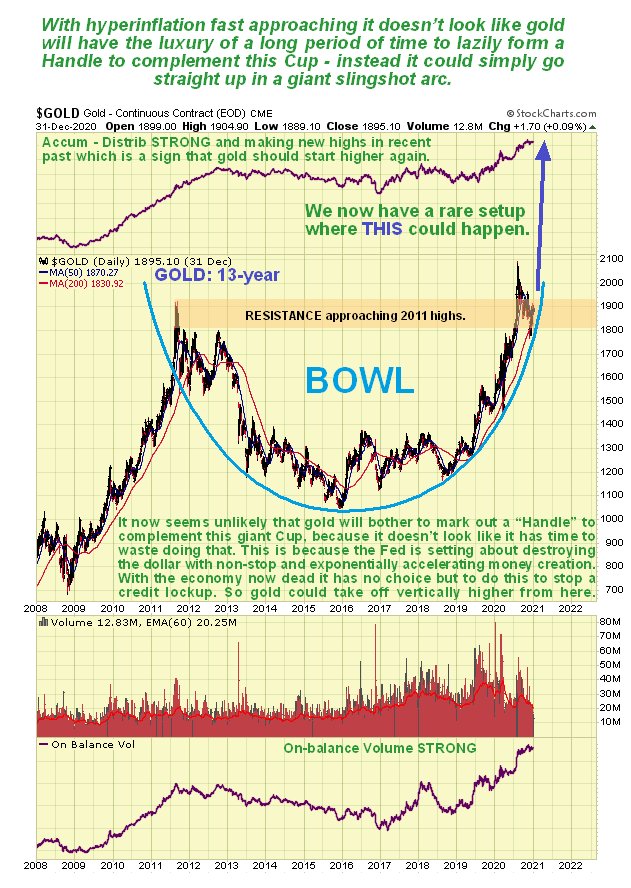
Starting with the 13-year chart, we see that gold is in the process of breaking out of a gigantic Bowl pattern. This is a very unusual setup that could slingshot it vertically higher soon. Gold has already punched through its 2011 highs last year, but has since reacted back below them which is thought to be a normal reaction prior to renewed advance. A big concern with a pattern like this is that it could stall out for a long time marking out a Handle to complement the Cup before continuing higher, but this doesn't look likely on this occasion because the dollar looks like it is on the verge of collapse with the Fed set to continue attacking it relentlessly.
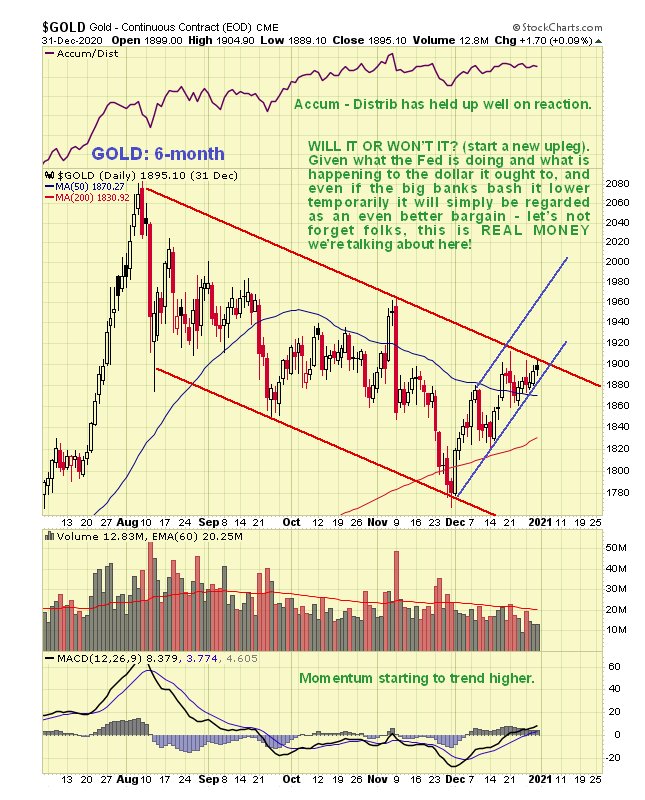
On the 6-month chart we can see gold's corrective downtrend from its highs of last August in detail. Right now it is at the upper boundary of this downtrend and so it could react back again. However, various factors suggest that it will soon get on with it and break out of this downtrend, which should lead to a vigorous ascent. If it should react back somewhat short-term it will simply be viewed as another buying opportunity.
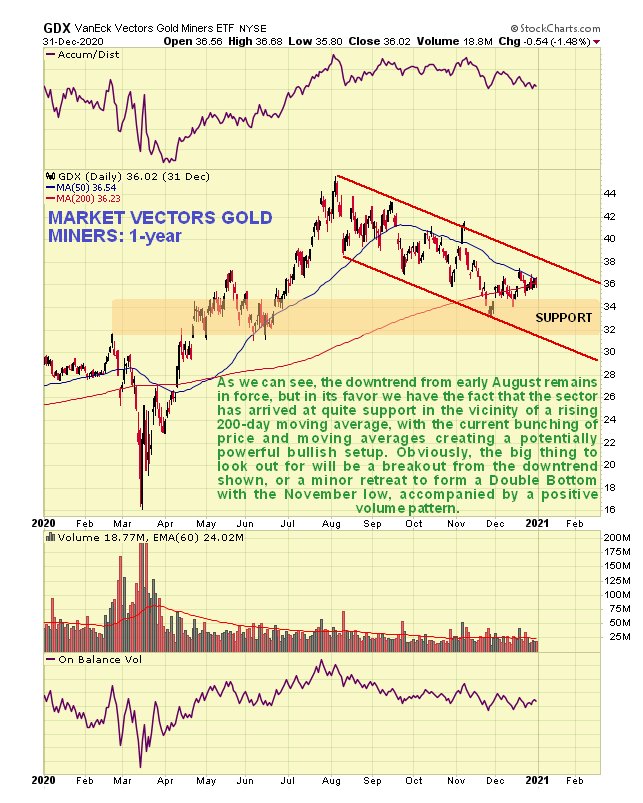
On the 1-year chart for GDX we can see that stocks are in a rather similar situation to gold itself, with the downtrend from the August high still in force, but various bullish factors coming into play that make an upside breakout likely soon, in particular the now tight bunching of the price and its moving averages and the fact that GDX is now in a zone of strong support.
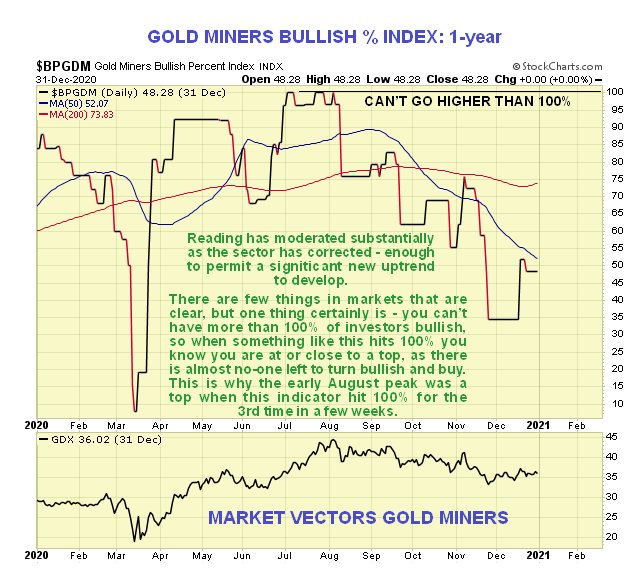
The Gold Miners Bullish Percent index shows that sentiment is now much better having dropped from 100% bullish when the correction started to its current level with less than 50% of investors bullish, so there is certainly room for a significant uptrend to get started.
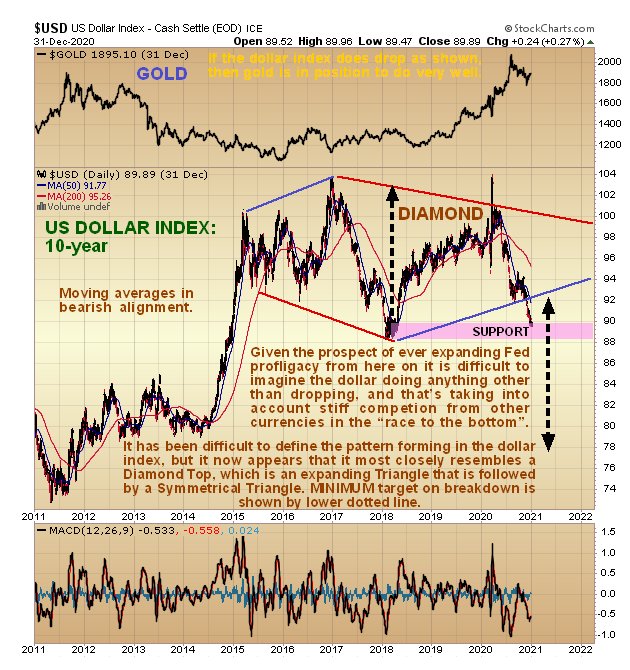
The dollar's charts look frightful, which is hardly surprising considering what the Fed is doing to it, with the Fed's balance sheet having doubled in less than a year and looking set to continue to expand at an ever greater rate. On the 10-year chart for the dollar index we can see that as recently as November it broke down from a giant Diamond Top and it looks like once it breaches the last ditch support in the 88 – 90 zone, it could go into freefall. If this happens it can be expected to "light a fire" under the precious metals sector.
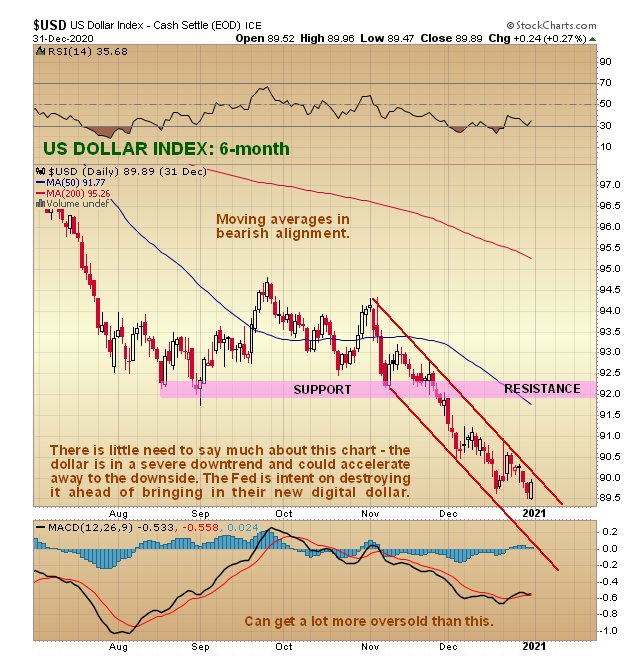
The 6-month chart for the dollar shows an entirely bearish picture with the current severe downtrend that started early in November remaining in force.
Originally published on CliveMaund.com on January 3, 2021.
Clive Maund has been president of www.clivemaund.com, a successful resource sector website, since its inception in 2003. He has 30 years' experience in technical analysis and has worked for banks, commodity brokers and stockbrokers in the City of London. He holds a Diploma in Technical Analysis from the UK Society of Technical Analysts.