TA AND CHART FOR WEDNESDAYHi - Tommer asked me to post a TA and Chart, so -- here it is. Hope it gives you a better idea of the potential of IIE.
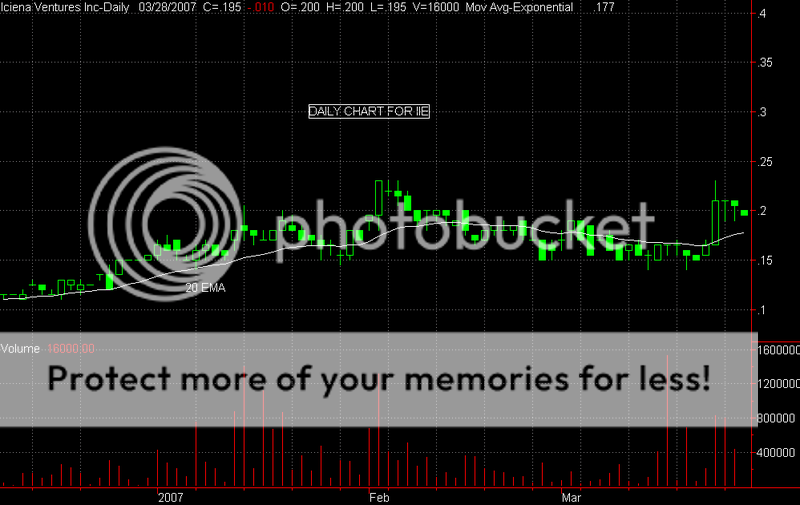
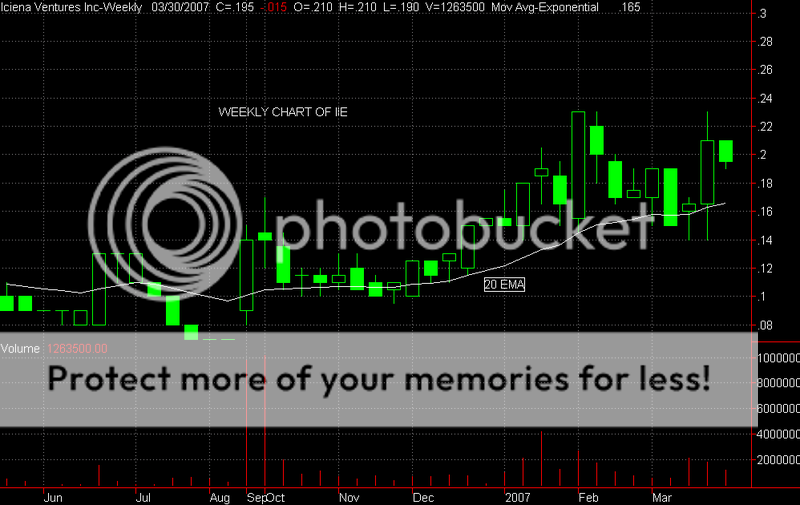
After a long consolidation in the .15 range, IIE is finally breaking out on some decent volume. On Friday, the stock made a strong breakout move to .23 and has since held in a high stall, roughly in the .21 to .19 range. This is very normal, especially when you see the stock holding at the top of the long white candle from Friday and with those long lower tails. These long lower tails tell us that there are buyers around in the .19 range - always a good sign. In my opinion, this is just the start of a new uptrend and it should breakout and run higher when this little pullback is completed. On the weekly chart, you can see why IIE is stalling for a few days -- any traders locked into the stock on the previous run to .23, are very willing to sell and get out even - happens all the time. So, IIE looks very good to me and we should see it trading higher, likely to the .30 range very soon. I think you will make some $$$$$$ on this one. Good luck. Here are the daily and weekly charts for IIE . Zeta