GREY:CIMVF - Post by User
Post by
zetaon Apr 16, 2008 12:31pm

300 Views
Post# 14976672
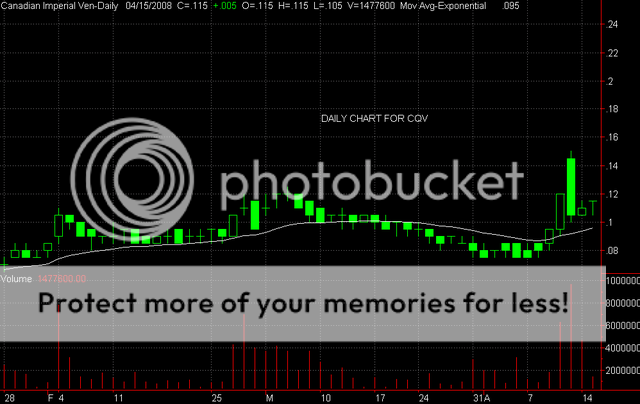
TA AND CHART FOR CQV
TA AND CHART FOR CQVHi -- Someone asked for a ta and chart for CQV -- so, here it is. I like the look of the CQV chart. It has just broken over the 20 ema and this now puts it into a decent uptrend. Also, over the last 5 trading days, CQV has formed what I call a spike and platform - the stock runs up on serious buying and then tops out and pullsback to form a ledge - this chart pattern is usually formed by the insiders and friends jumping into the stock. Notice as well, that on Monday, the stock gapped up from .12 to .14 or so and then sold off all day -- this again is very normal -- The ledge is now forming at .11 or so and I would expect CQV to make an upside run very shortly - and would rate it as bullish at this time - so -- if you are long, I would hold for more upside - if you are thinking of buying - try .11 and that would be a decent entry. Expect resistance in the .30 range. Hope this helps. Here is the daily chart . Good luck. Zeta