GREY:ENGFF - Post by User
Post by
zetaon Apr 19, 2008 2:40pm

353 Views
Post# 14988578
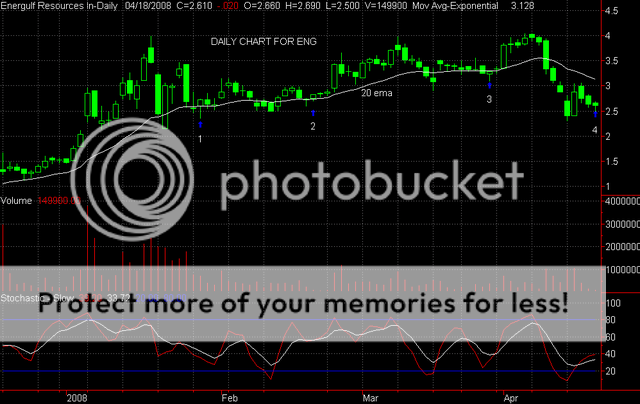
TA AND CHART FOR MONDAY
TA AND CHART FOR MONDAYHi -- Not a bad week for ENG, bu it is still not out of the woods -- The bottom line is ENG is trading under the 20 ema and is therefore still in a downtrend . Until we see a good strong reversal, with confirmation and increasing volume --it is a toss up. That was a bullish black hammer on Friday and a decent sign -- however, we need confirmation of this signal -- confirmation of this bullish candle would price action above the hammer - ideal on Monday would be a white candle with a higher high and higher low then the hammer -- so, we are looking for a close above $2.69 and a low above 2.50 -- that would indicate that a change in trend is starting. The stochastic has crossed over , indicating bullish potential as well. As I said, ENG is still vulnerable. If it breaks under the low of the hammer on Friday - 2.50, then expect more downside - likely to the 2.40 range .
Here is the daily chart for ENG -- Good luck with this one. Zeta