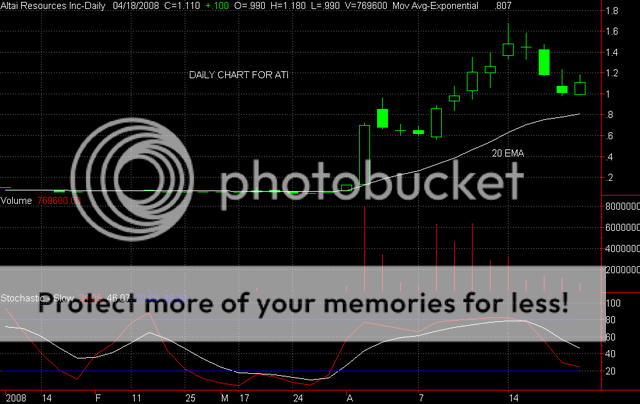
TA AND CHART FOR MONDAYHi -- A strong finish to the week for ATI -- the candle on Friday was a bullish white candle and the candle pattern is a Bullish Engulfing pattern. This is a very good sign that the bottom is in for the pullback . The candle today was also confirmation for the bullish hammer on Thursday - so, 2 bullish candles back to back -- good sign I say. The stochastic is approaching oversold and it appears that it is starting to turn up - again, a bullish indicator. The pullback for ATI did not get to the 20 EMA , but this is a sign that there is good support ready to let their buying do the talking. I think you can buy ATI here, but to be sure, you might want to wait for it to break over 1.18 - The second leg of the uptrend has the potential to run to $1.90 or so -- not saying it will -- just the potential if the cards play out - for now, look for the breakout over 1.18 -- Looks good to me. Here is the daily chart for ATI - Good luck with this one. Zeta