TA AND CHART FOR WEDNESDAYHi - Someone asked for a ta and chart, so, here it is.
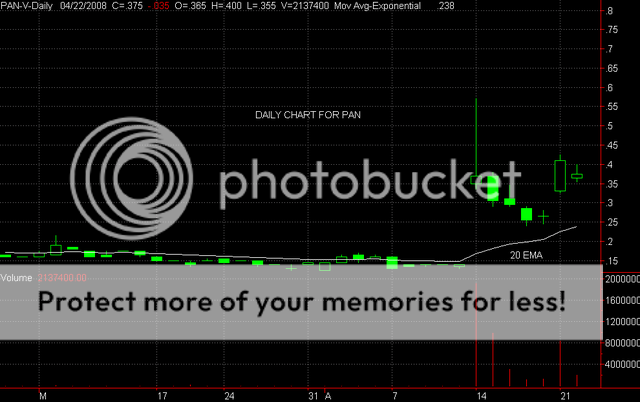
PAN had a nice bullish candle yesterday but today was not great. This was a weak day, as the stock should have been on the move after the long white bullish candle yesterday. Also, there was a gap down opening and PAN made little headway during the day - this pattern of Harami cross can be a potent sign that the run is over - but really, there has been no run to speak of, so,perhaps it is just getting started. I like the area play it is involved and I would expect much more excitement from the play -- so, wait and see how it makes out tomorrow. A white bullish candle closing above .40 would be a very bullish sign -- a drop and close under the low of the candle today would be bearish -- so, bearish if it breaks under .355. The chart if not great, but I think there is more to come from the stocks in this play, so I would bet that PAN is going higher. Here is the daily chart for PAN -- good luck tomorrow with this one. Zeta