TA AND CHART FOR MONDAYHi --Someone asked for a ta and chart, so, here it is.
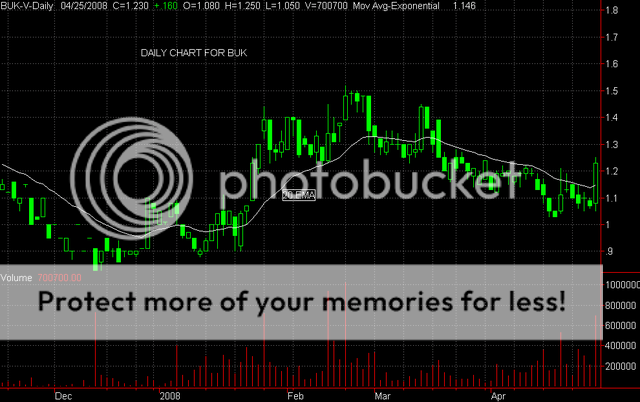
I think BUK was looking very strong today. That was a strong long white candle today - and a nice increase in volume - BUK has just completed a double bottom in the 1.05 range and then today it broke out on good volume, closing well above the 20 ema -- we should now see an uptrend start to build. The candle pattern today was an F-Tam White Bullish pattern and it is a strong buy signal -- So -- the trend is now up for BUK and I would think it should move up into the 1.40 to 1.50 range in the near term -- looks very good to me. Good luck with this one. Here is the daily chart. Zeta