GREY:ENGFF - Post by User
Post by
zetaon Apr 28, 2008 9:09pm

531 Views
Post# 15017411
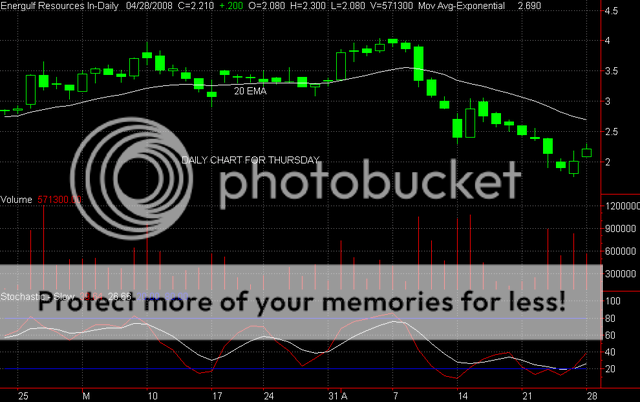
TA AND CHART FOR TUESDAY
TA AND CHART FOR TUESDAYHi -- Another good day for ENG, but I was expecting it to run higher. It seemed as if the stock ran out of gas over the 2.25 mark-- meaning that there are still lots of willing sellers around, so, ENG will have to slowly works it's way through the overhead supply. The candle today was a white bullish candle, but more important, it confirms the bullish engulfing pattern from yesterday and I would be expecting more bullish upside. I also think the gap up at the opening was a bullish sign -- a sign that there are buyers around. So -- I think we are looking at a few more days of upside at least - likely to the resistance around the 2.50 to 2.70 -- notice that the 20 ema is now at 2.69 -- this is a good trading target to keep in mind. Looks good for tomorrow !! Good luck with this one. Here is the daily chart. Zeta