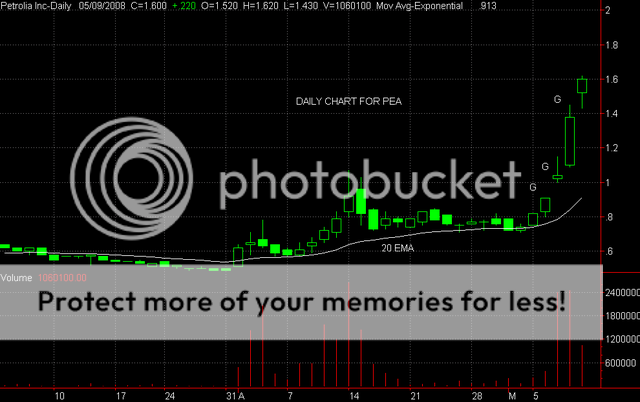
TA AND CHART FOR PEAHi - Someone asked for a TA and chart, so, here it is.
PEA has had a terrific run and it could go higher -- there is certainly nothing on the chart right now that suggests that the run is over -- however, having said that - PEA has had 3 good gap ups on this run and this is usually a good time to start watching for a top out - 3 bullish gaps, followed by a black candle is generally a good sign that the run needs a rest -- so, I would be watching for a black candle to form -- until then - let it ride I say - yes, we might be close to the top of the run, but, there might still be a lot more, so, let the action of the stock dictate your market action -- So, I would be using a stoploss - mental is better then nothing, of the low of the previous candle - however, after the first hour or so of trading, I would switch my stoploss to the low of the trading day -- so, today, your line in the sand will be 1.43 - the low of the candle to date. Sure, you might get whiplashed out, but you also might be out of the stock near the top when the correction sets in - So -- I say let it ride - this is a very powerful uptrend and could have more steam - but be prepared to protect those profits with a stop at the low of the trading day -- Another good indicator of a top is to watch the stochastic indicator - it is riding at 91 or so ,now - turns down and breaks under 80 -- time to take profits . I hope this helps and good luck with this one. Here is the daily chart. Zeta