Join today and have your say! It’s FREE!

Become a member today, It's free!

We will not release or resell your information to third parties without your permission.
Please Try Again
{{ error }}
By providing my email, I consent to receiving investment related electronic messages from Stockhouse.

or

Sign In

Please Try Again
{{ error }}
Password Hint : {{passwordHint}}
Forgot Password?

or

Please Try Again {{ error }}

Send my password

SUCCESS
An email was sent with password retrieval instructions. Please go to the link in the email message to retrieve your password.

Become a member today, It's free!

We will not release or resell your information to third parties without your permission.
Quote  |  Bullboard  |  News  |  Opinion  |  Profile  |  Peers  |  Filings  |  Financials  |  Options  |  Price History  |  Ratios  |  Ownership  |  Insiders  |  Valuation

Questerre Energy Corp (Canada) T.QEC

Alternate Symbol(s):  QTEYF

Questerre Energy Corporation is an energy technology and innovation company. It is engaged in the acquisition, exploration, and development of oil and gas projects, in specific non-conventional projects such as tight oil, oil shale, shale oil and shale gas. It holds assets in Alberta, Saskatchewan, Manitoba and Quebec in Canada, as well as in the Kingdom of Jordan (Jordan). Its oil shale assets include its project in Jordan and its investment in Red Leaf Resources Inc. (Red Leaf). It plans to utilize the Red Leaf technology for its project in the Kingdom of Jordan. In Quebec, the project has a comprehensive program to test the carbon storage potential including injection and monitoring wells, compression facilities and a pipeline to an adjacent industrial park. Its Kakwa area is a liquids-rich Montney natural gas resource play situated over 75 kilometers (km) south of Grande Prairie in west central Alberta. Its Antler area is over 200 km southeast of Regina in southeast Saskatchewan.


TSX:QEC - Post by User

Post by zetaon May 09, 2008 12:04pm
514 Views
Post# 15056251

TA AND CHART FOR QEC

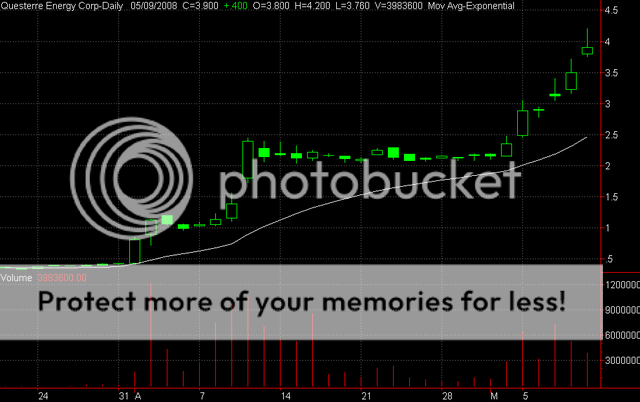
TA AND CHART FOR QECHi - Someone asked for a ta and chart for QEC -- so, here it is.
QEC has had a great run, but it appears to be getting overextended at this point. We have seen 4 bullish gaps in this run and it is certainly time to be watching for a possible top reversal candle or pattern. The candle forming today so far is a bearish candle - it has a long upper shadow -- sign of lots of selling come out -- it is forming a shooting star candle or hanging man candle - both bearish, so -- this could very well be the reversal and correction warning. I would use a stoploss at the low of the candle today -- 3.76 - breaks this and it is very likely a correction is around the corner if it keeps run, you are still in the game!! -- If it does not break under this 3.76 market today, then the sell confirmation would be a black candle on Monday, with a lower low and lower high -- looks like a major reversal warning is forming in my opinion. Hope this helps. Here is the daily chart to date. Zeta
Bullboard Posts