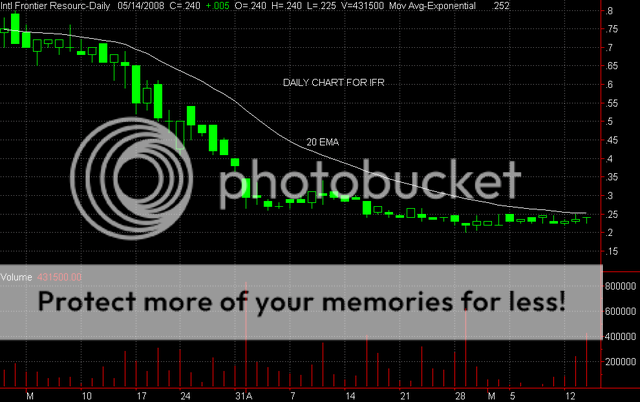
TA AND CHART FOR THURSDAYHi - Mogate asked me to post a chart for IFR - I have not position long or short in this stock - this is just a service provided for Mogato. Hope it helps.
IFR has taken a hit, off from the 1.60 levels. The stock is still in a downtrend, trading under the 20 ema, but it seems to have finally found support around the .20 level. Recently, the stock has picked up a little, showing several white bullish candles, with support coming in around .225 or so. There have been some high volume days - but the stock did nothing, so they were likely crossed. I think your stock has bottomed and found decent support in the .22 to .25 range and it would not be a bad one to accumulate at this level - there is no sign yet that an uptrend is near, but you never know -- So -- looks very oversold in this .225 range and the stochastic is actually starting to look more bullish . I would sit on any position -- there is very little resistance until at tleast the .60 mark, so, it should recover quickly -- Good luck on this one. Here is the daily chart. Zeta