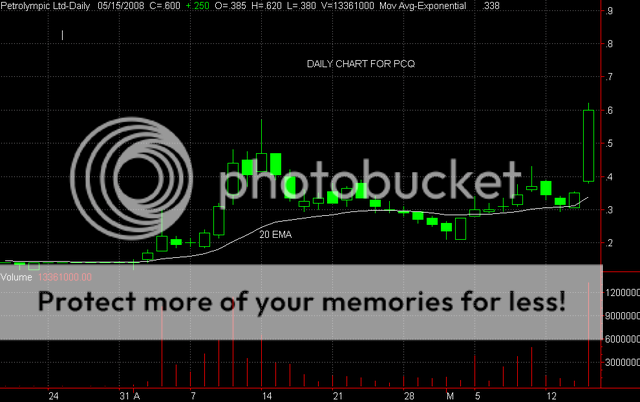
TA AND CHART FOR FRIDAYHi - Someone asked for a TA and Chart, so, here it is.
I think PCQ looks incredible!! This is the perfect chart pattern. The stock has broken out of a long consolidation on great volume. Notice that the candle today is a bullish long white candle that closed very close to the top of the candle -- a good sign that there will be a strong opening in the morning and a very strong up day tomorrow. I would be looking for at least 3-4 days of uptrending, as PCQ is just starting to build momentum. The trick with this type of play is to stay with the trend and try and get as much out of it as possible.I would stay with the trend until you at least see a bearish candle - a black candle and best if it is one of the good top indicators like a doji , or shooting star or even dark cloud cover -- if you are not sure of these indicators, just ask and I will gladly comment again. -- for now, I would sit on those hands and let it ride!! A run to the $1 level seems reasonable before a pullback, but, best to wait and see what come. Looks good for some quick profits to me . Good luck with this one. Here is the daily chart. Zeta