GREY:WEWWF - Post by User
Post by
zetaon May 16, 2008 12:43pm

335 Views
Post# 15082081
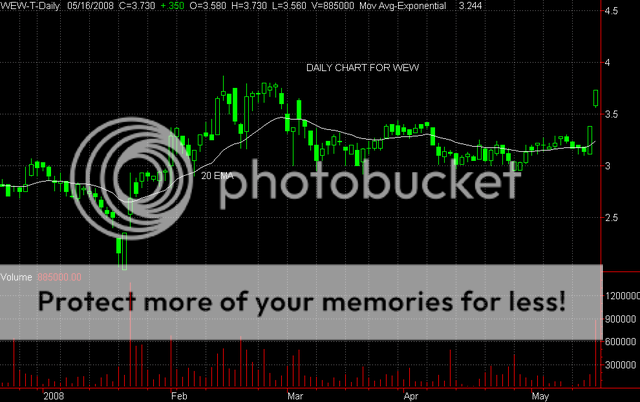
TA AND CHART FOR WEW
TA AND CHART FOR WEWHi - someone asked for a ta and chart for WEW -- so, here it is.
WEW is looking very strong today. It had a very strong bullish gap on the opening and has maintained the upward momentum. This is a very bullish chart, as the stock is fast approaching the old pivot highs in that 3.90 range-- once it breaks out over the $4 level, it should have no trouble moving to the $7 range. Notice the long consolidation pattern in the $3 to 3.50 range -- all very strong accumulation in my view -- so, with the gap up and the huge increase in volume, I would say that WEW is just getting started and you can look for much higher prices -- $4, followed by a run at $7 -- Hope this helps. Good luck with this one. Zeta - here is the daily chart to date.