Join today and have your say! It’s FREE!

Become a member today, It's free!

We will not release or resell your information to third parties without your permission.
Please Try Again
{{ error }}
By providing my email, I consent to receiving investment related electronic messages from Stockhouse.

or

Sign In

Please Try Again
{{ error }}
Password Hint : {{passwordHint}}
Forgot Password?

or

Please Try Again {{ error }}

Send my password

SUCCESS
An email was sent with password retrieval instructions. Please go to the link in the email message to retrieve your password.

Become a member today, It's free!

We will not release or resell your information to third parties without your permission.
Quote  |  Bullboard  |  News  |  Opinion  |  Profile  |  Peers  |  Filings  |  Financials  |  Options  |  Price History  |  Ratios  |  Ownership  |  Insiders  |  Valuation

Noront Resources Ltd. NOSOF

Noront Resources Ltd is a mining company. It is engaged in the exploration, development, and acquisition of properties prospective in base and precious metals, which includes nickel, copper, platinum group metals, precious metals, chromite, and vanadium. The company's developmental project consists of Eagle's Nest nickel-copper-platinum-palladium deposit, deposits of high-grade chromite and copper-zinc volcanic massive sulphide deposits which are part of the company's McFauld's Lake Project. Its assets are located in the area known as the Ring of Fire in the James Bay Lowlands, Ontario.


OTCPK:NOSOF - Post by User

Bullboard Posts
Post by zetaon Jun 04, 2008 5:21pm
364 Views
Post# 15146119

TA AND CHART FOR THURSDAY

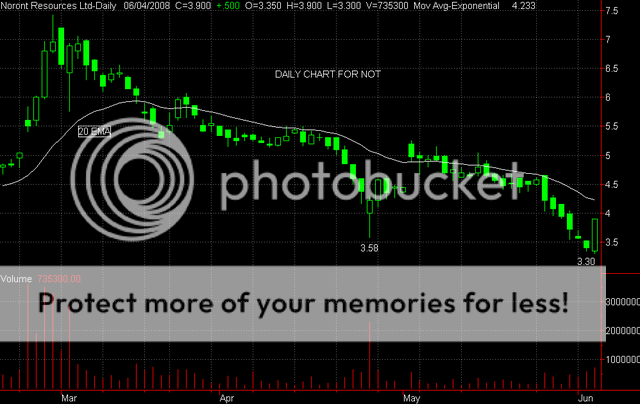
TA AND CHART FOR THURSDAYHi -- Someone asked for a ta and chart, so, here it is.
After taking a beating for several sessions, NOT finally printed a bullish candle today. The candle today is a strong Bullish Engulfing candle and notice that it wraps around the total black candle from yesterday -- around the high and low - this makes it an especially bullish candle and is a strong buy signal. As well, this engulfing candle is even more bullish because it engulfs the last two black candles - a double engulfing candle pattern - again, very bullish. Confirming this buy signal is the crossover of the stochastic at a low level -- when you find a low stochastic combined with a bullish engulfing candle after a long downtrend, it is usually easy money -- we should see a nice pop from here - to start with, a run to the resistance around 4.25 to 4.50 seems in the cards over the near term. Hope this helps. Here is the daily chart. Zeta
Bullboard Posts