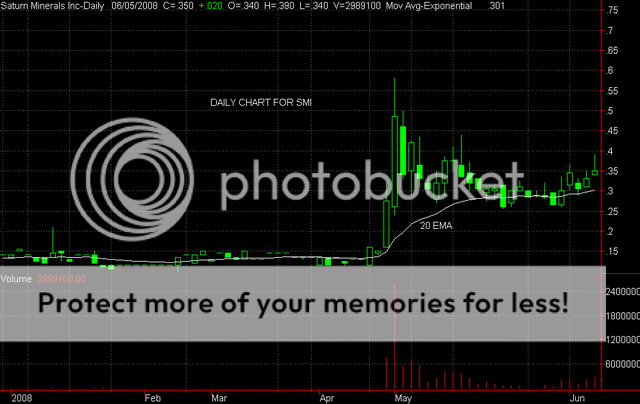
TA AND CHART FOR FRIDAYHi -- Someone asked for a ta and chart, so, here it is.
SMI is in a long sideways consolidation, roughly in the .26 to .45 range. It has tried several times to make a move upward, but gets hit with sellers and -- down it comes. However, I think the rally on Monday was enough to clean up the overhead and I think the stock is now breaking out nicely -- the candle today was an inverted hammer -- bullish in this position, so I would expect more upside tomorrow and next week. SMI has good support on the 20 ema and I would expect a decent run up, say to around the .60 to .70 range. So -- the action is just starting for SMI -- you should do fairly well on this one. Good luck. Here is the daily chart.