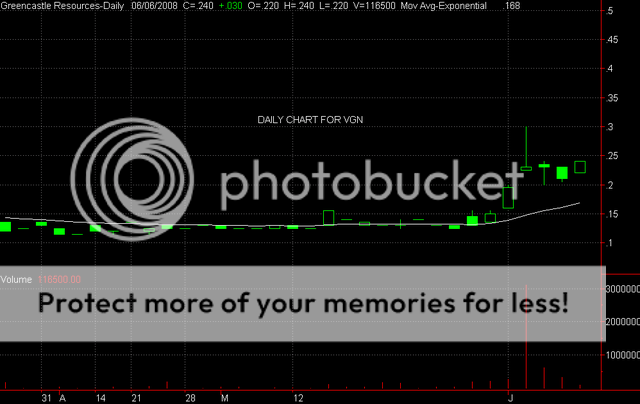
Early Ta and ChartHi -- Someone asked for a ta and chart, so, here it is.
I think VGN is a classic chart. We had a nice spike on Tuesday and then the holding pattern while it cleaned up. There are always sellers after a stock spike - players that have been locked into the stock for years just want to bail and get out even -- so -- the stock pulls back after the insider spike. This is called a spike and ledge pattern and is usually a good $$$$$$$ maker. A bullish white candle is forming today, so, perhaps VGN is ready to make an upward move - it looks good to me and the long lower shadow on the candle from Tuesday shows that the buyers are in control and look to be priming this one for a run. I would consider VGN a buy at this .22 to .24 level and certainly one you would want to sit on and give it a chance to get moving. Looks very good to me -- good luck with this one. Here is the daily chart. Zeta