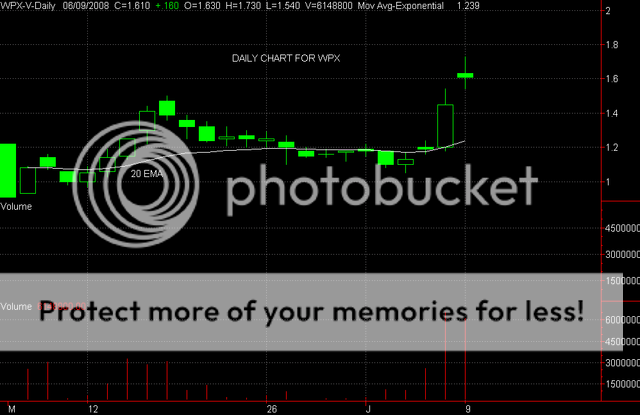
TA AND CHART FOR WPXHi -- Someone asked for a TA and Chart for WPX -- so, here it is.
The candle today was a long legged Black Doji and has the potential to be a reversal pattern. The pattern is also a doji star pattern, which also is a potential reversal pattern. However, one always has to look at the complete chart to see what is happening - notice that there was heavy accumulation of WPX for 3 weeks after the jump from the $1 level to $1.50 -- someone was filling their pockets in the 1.20 to 1.40 range, so, I doubt if this is the end of the move - When a stock gaps up and then trades heavy volume and forms one of these doji candles, it is always time to be careful -- is it a top ? or is it just the start of the run ? If this black doji had come after a long uptrend, then, yes, it would likely be a top and time to lighten up -- but, it did not have much of a run - in fact, it is just starting the second leg up -- so -- I think there is a lot more upside to this one -- I bought on the breakout on Friday and will just let it ride and see what comes down - you will know very quickly in the morning -- watch that low of the doji -- if WPX trades under this price -- 1.54, then it is not a good sign -- however, moves out over the high of 1.73 and you know the game is just starting. With a stock like this it is very easy to get whipped around, so, I will use a stoploss of 1.45 - keeps going up and I am in the game --- However, having said that -- I think WPX is going over the $2 level very quickly and would not be too surprised to see another gap up in the morning. Good luck on this one. Here is the daily chart. Zeta