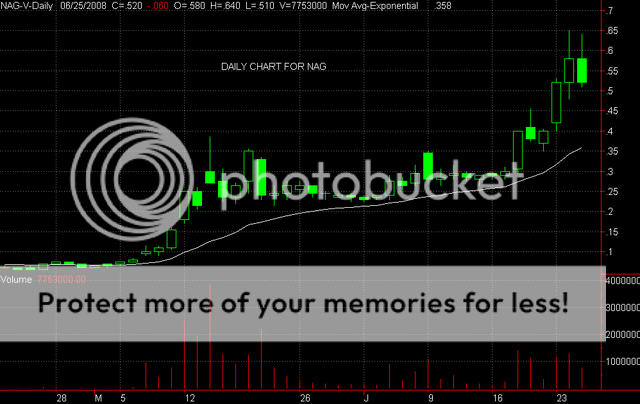
EARLY TA AND CHARTHi -- NAG has certainly moved into a consolidation stage today -- The candle forming is a bearish black candle and has the potential to be a bearish engulfing candle -- at any rate---his does not look like a top pattern to me -- the volume is not high enough and there is not enough selling pressure. I would think the bottom is in at .51 at least for today -- NAG has the potential to consolidation in this .50 to .60 range for 2-3 days and then make another run -- a breakout over .65 should have the momentum to go to $1 or so. So -- at this point, it is a tossup -- as with all consolidations - I sold on the .55 stoploss but will be looking to get back in -- depending on what happens in the pullback -- we will see soon enough today and tomorrow - if the support at .51 or even .50 can hold -- then we can count on more upside action -- I would certainly buy a breakout over .65 -- so for now, I would wait -- would be a very good sign if NAG can finish the day over .55 -- Good luck with this one. Here is the intraday chart. Zeta