TA AND CHART FOR THURSDAYHi -- here is the ta and chart for SMI
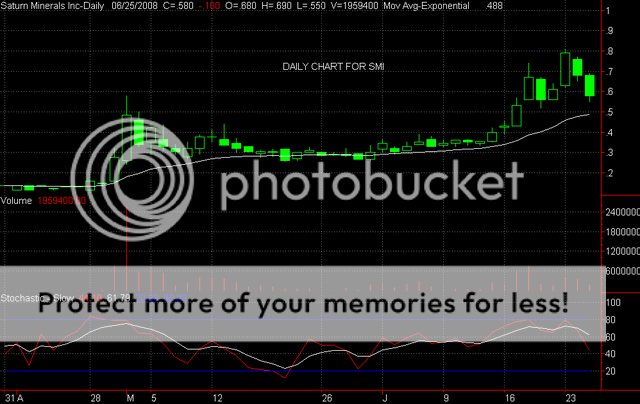
SMI has broken down fairly badly -- today it printed another bearish black candle and broke under the support at .62 rather easily -- usually stocks will find some support at the low of those long white candles, but not the case today. As well, the stochastic has crossed down -- also bearish. I would expect more downside tomorrow - it was weak at the close and will likely find support at the .50 level tomorrow. I think the stock still has a chance, as the uptrend was just getting underway -- but those bearish candles do not look good -- my opinion is that at this point -- it is a sell -- Good luck with this one -- Here is the daily chart. Zeta