GREY:ENGFF - Post by User
Post by
zetaon Jun 26, 2008 9:20am

364 Views
Post# 15231196
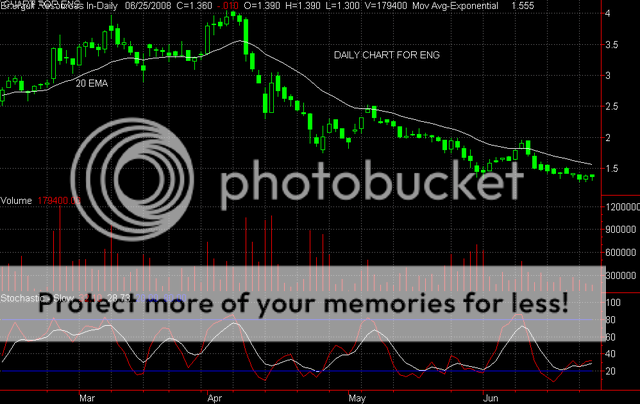
TA AND CHART FOR THURSDAY
TA AND CHART FOR THURSDAYHi -- ENG continues to build a very strong base in the.130 to 1.40 range -- the fact remains -- someone is buying all that stock that is trading here. The candles are very bullish!! Notice all the lower tails over the last 4 trading days -- a sign that the buyers are lurking -- just waiting for the stock to come to them. Yesterday we had a black hammer candle, which is bullish and the stochastic has crossed over at a low level -- a very bullish sign. ENG has been oversold for some time now and that usually means that when it moves, it will move very easily to higher levels. There is still no volume indication of positive drilling news, but that could happen anytime -- I repeat -- someone always knows and they leave footprints on the chart -- I started buying back my position last week -- notice the white hammer candles last Wednesday and last Friday -- in fact, over the last week or so, ENG has shown a number of bullish hammers or almost bullish hammer candles -- a very decent sign -- so -- I think ENG is a buy in this 1.30 to 1.40 range -- yes, there is risk -- but that is what the stock market is all about. Good luck today!! Here is the daily chart.. Zeta