GREY:ENGFF - Post by User
Post by
zetaon Jul 09, 2008 6:17pm

571 Views
Post# 15275401
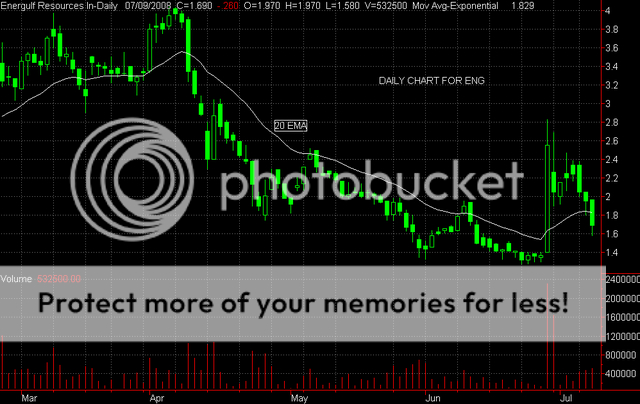
TA AND CHART FOR ENG
TA AND CHART FOR ENGHi -- Things just keep getting worse for ENG -- That was another bearish black candle today and it broke under the 20 ema, so another downtrend is now in place. Notice that the 20 ema has also turned down -- another bearish sign. -- four lower highs and four lower lows over the last 4 days does not look good. There is support at 1.60 or so, but then --- 1.40 is the next major support line. This does not look like a stock that has found oil -- but, you never know. There is no sign of a reversal at this point, so I would expect more downside tomorrow. Sorry to be so bearish, but there are a lot of black candles in this steep decline -- not a good sign. I think you are better off out of the stock at this point -- just sit back and wait for a bullish reversal of some sort - at least, that is the way I am playing it now. Good luck with this one tomorrow. Zeta. Here is the daily chart.