TA AND CHART FOR WEDNESDAYHi -- Banker asked for a ta and chart, so, here it is.
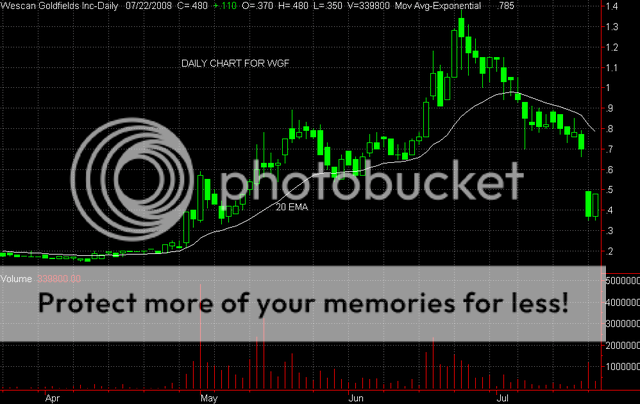
WGF is not looking good!! The stock started cracking down around July 8 and there has been heavy selling since then--until finally the huge downside gap on Monday -- a result of the negative news from GXS -- The chart for WGF is showing a nice bullish candle today, but at the most, I would be looking for 1-2 days upside - perhaps -- perhaps to the .60 mark -- in which case, I would be a seller . This whole coal play is having lots of trouble after the poor results from GXS, so, I would want to be on the sidelines for now - sure, down the road, it might get interesting, but for now -- best on the sidelines I say. I would have a stoploss at .45 -- breaks under this sell -- and if it rallies up to .60 or so -- sell - you can always buy it back. WGF will have a lot of trouble going very far on the upside because of all the traders locked in with losses -- you know the game yourself -- gets back to your breakeven price and you are a seller -- and that is what will prevent WGF from making a strong run in the near future. Sorry this ta is so bearish, but this is a bearish chart and the stock is best sold. Here is the daily chart for WGF -- good luck with this one. Zeta