Join today and have your say! It’s FREE!

Become a member today, It's free!

We will not release or resell your information to third parties without your permission.
Please Try Again
{{ error }}
By providing my email, I consent to receiving investment related electronic messages from Stockhouse.

or

Sign In

Please Try Again
{{ error }}
Password Hint : {{passwordHint}}
Forgot Password?

or

Please Try Again {{ error }}

Send my password

SUCCESS
An email was sent with password retrieval instructions. Please go to the link in the email message to retrieve your password.

Become a member today, It's free!

We will not release or resell your information to third parties without your permission.
Quote  |  Bullboard  |  News  |  Opinion  |  Profile  |  Peers  |  Filings  |  Financials  |  Options  |  Price History  |  Ratios  |  Ownership  |  Insiders  |  Valuation

Questerre Energy Corp (Canada) T.QEC

Alternate Symbol(s):  QTEYF

Questerre Energy Corporation is an energy technology and innovation company. It is engaged in the acquisition, exploration, and development of oil and gas projects, in specific non-conventional projects such as tight oil, oil shale, shale oil and shale gas. It holds assets in Alberta, Saskatchewan, Manitoba and Quebec in Canada, as well as in the Kingdom of Jordan (Jordan). Its oil shale assets include its project in Jordan and its investment in Red Leaf Resources Inc. (Red Leaf). It plans to utilize the Red Leaf technology for its project in the Kingdom of Jordan. In Quebec, the project has a comprehensive program to test the carbon storage potential including injection and monitoring wells, compression facilities and a pipeline to an adjacent industrial park. Its Kakwa area is a liquids-rich Montney natural gas resource play situated over 75 kilometers (km) south of Grande Prairie in west central Alberta. Its Antler area is over 200 km southeast of Regina in southeast Saskatchewan.


TSX:QEC - Post by User

Post by zetaon Jul 23, 2008 9:17pm
725 Views
Post# 15323547

TA AND CHART FOR THURSDAY

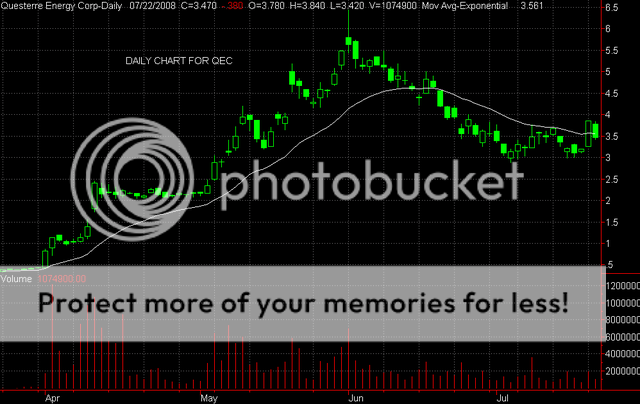
TA AND CHART FOR THURSDAYHi -- Someone asked for a ta and chart -- so, here it is.
I think QEC has come out of the bear market trend very nicely. The stock bottomed at $3 or so and then retested the low last week and it held nicely. This action produces a double bottom on the chart and it a good sign that the worst is over for QEC -- Yesterday was a very bullish white candle that broke out over the 20 ema and this was a strong sign - the little pullback today was very normal, but I would be looking for more upside tomorrow. I think there is a good chance that QEC will retest thoses support areas around $5 and then around $6 - for now, I would be looking for a run to the $5 range. So -- QEC is looking fairly bullish at this time and the buyers seem back in control. I would give the stock a chance to run again -- but -- breaks under $3 -- just sell !! Good luck with this one. Here is the daily chart. Zeta
Bullboard Posts