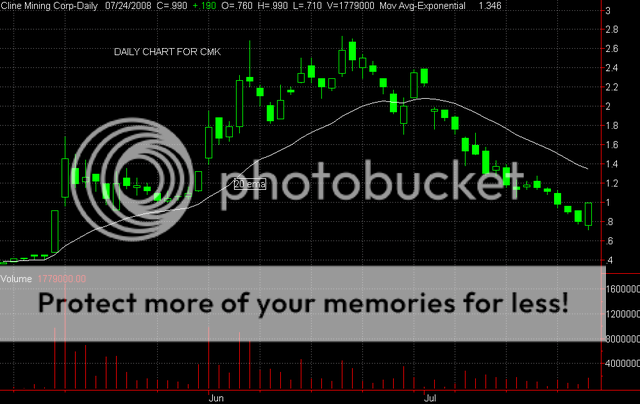
TA AND CHART FOR FRIDAYHi -- Fats asked for a ta and chart, so, here it is. Nice day for CMK and this rally was certainly overdue. This was a very strong reversal pattern today. It is a total bullish engulfing candle, meaning that it has completely wrapped around the previous black candle. As well, the stochastic is also bullish, crossing over at a low reading. When you see a bullish signal, it is best to check the Bollinger Bands as well -- if the stock is on or near the lower band, the signal is usually very valid and can be taken - in the case of CMK -- it is bouncing off the lower Bollinger Band, so, this is good . - Also note that the stock closed right at the high of the day - .99, forming a bullish top - this usually indicates that we can expect more of the same uptrend tomorrow. As I said yesterday - any rally would likely take it to the 20 ema -- which is around 1.35 -- so, this is a good place to be watching for bearish - black - candles. I would be inclined to stick with CMK until another black candle appears -- this would be a good sign that the rally is weakening and it might have to retest the .80 support level . So -- looking much better tonight - expect some upside action tomorrow. Good luck with this one. These are very tricky markets !! Here is the daily chart. Zeta