Crescat Capital Quarterly Investor Letter Q4 2020 Crescat Capital Quarterly Investor Letter Q4 2020
Crescat Capital
January 28, 2021
January 28, 2021
Dear Investors:
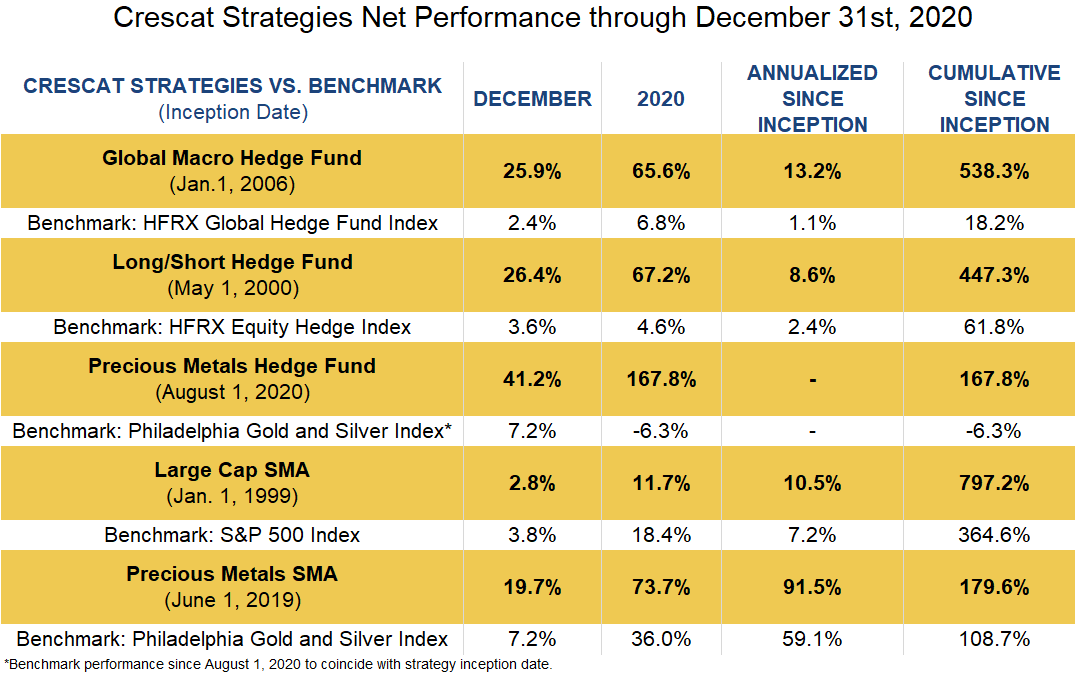
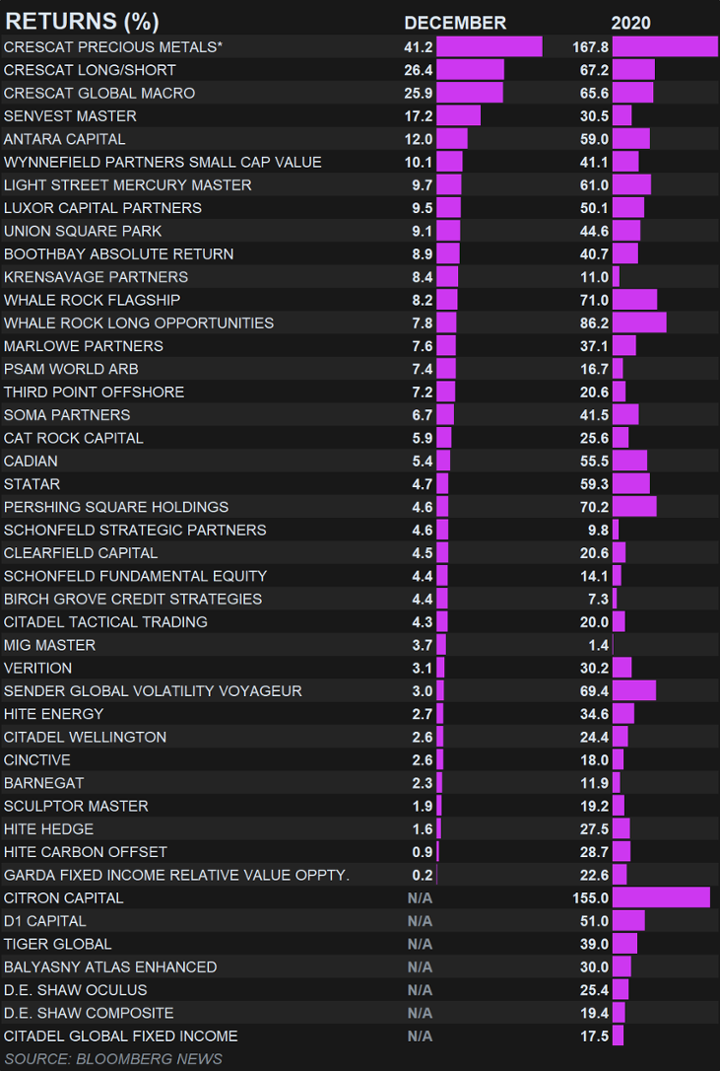
Crescat finished strong in 2020 to capture the top three spots in the Bloomberg News US hedge fund performance table for December. All three Crescat funds made it into Bloomberg’s top 10 for the full year with the Crescat Precious Metals Fund taking the #1 spot. We are working as hard as ever to continue to deliver in 2021. We see an incredible macro investing setup today as we explain herein.
As profiled in our recent letters, the stage is set for a massive investor shift out of overvalued mega cap growth stocks and fixed income securities and into undervalued materials, energy, and other commodities. We believe it is the dawn of what we are calling the Great Rotation. The preconditions are summarized as follows:
- The Democratic sweep opens the way for full Modern Monetary Theory implementation;
- Janet Yellen as Secretary of the Treasury brings the Fed and US Government onto the same team;
- The appointment of Bernie Sanders as the Chairman of the Senate Budget Committee sets the tone for a fiscal spending explosion;
- Jerome Powell “welcomes” inflation and is “not even thinking about thinking about raising rates”;
- The Fed’s quantitative easing is on autopilot at $120 billion per month with no end in sight;
- Twin budget and trade deficits have continued to deteriorate and are now at 25% of nominal GDP;
- Record valuations for stocks and fixed income securities;
- Historic global debt to GDP imbalances;
- Extreme bullishness and speculative long positioning in overvalued large cap growth and tech stocks;
- Historic relative undervaluation of commodities and equities of basic resource companies;
- Investor overconfidence in Fed to keep stocks and credit buoyed without creating significant inflation;
- The Fed will likely no longer be able to keep both interest rates and inflation down at the same time;
- Inflation is catalyst for the Great Rotation, the end game for popular risk parity hedge fund strategies;
- Forget about the “output gap”: Inflation today starts with the “input gap” – rising wholesale prices due to underinvestment in commodity industries that will lead to supply shortages;
- Aggregate demand meanwhile is indeed boosted by MMT;
- Money printing combined with declining negative real rates are creating explosive macro demand drivers for gold and silver;
- Precious metals represent the core asset class for capital preservation in a rising inflation and overvalued financial asset world;
- All fiat currencies globally are being devalued relative to gold;
- The US dollar is not the structurally weakest fiat currency;
- The Chinese yuan and Hong Kong dollar represent two of the most overvalued currencies on the planet today in Crescat’s analysis;
- China has created a massive $46 trillion USD of credit in its banking system which is insolvent; and
- The Chinese banking bubble is four times greater than the bank asset to GDP imbalance in the US at the peak of the housing bubble ahead of the 2008 GFC creating emerging markets FX risk that much of investing world is oblivious to today.
The Largest Wealth Transfer in History
Contrary to the narrative we often see, today’s mix of monetary and fiscal policy are having a very different economic impact then we saw post the global financial crisis. Then, deflationary forces were exacerbated by a brutal wealth loss problem, which was especially the case among the lower classes of society. The bottom 50% lost over 84% of their net worth from 2007 to 2011. In the wake of the Covid-19 recession, we have seen the opposite effect. The lower classes just increased their wealth to the highest annual amount in the history of the data. Their net worth increased by almost $500 billion in one year.
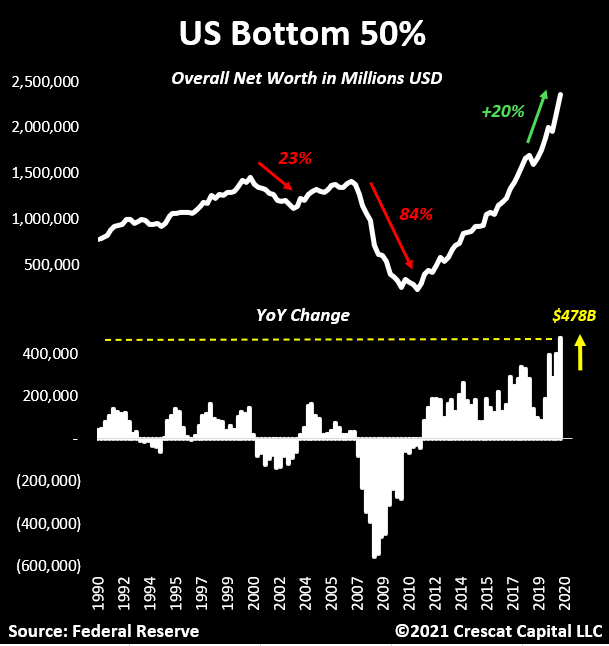
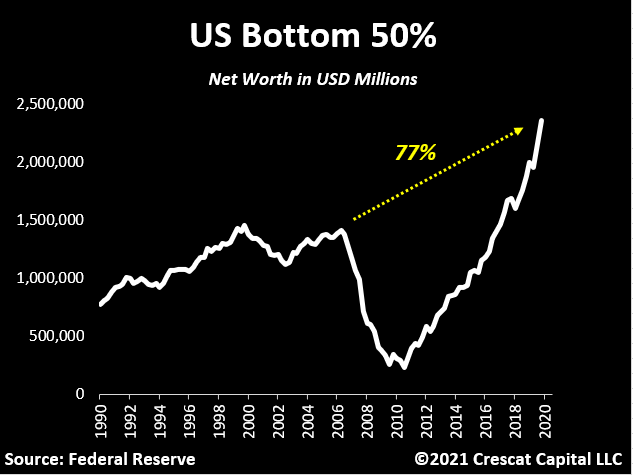
In fact, the bottom 50% net worth is now 77% higher than it was at the peak of the housing bubble.
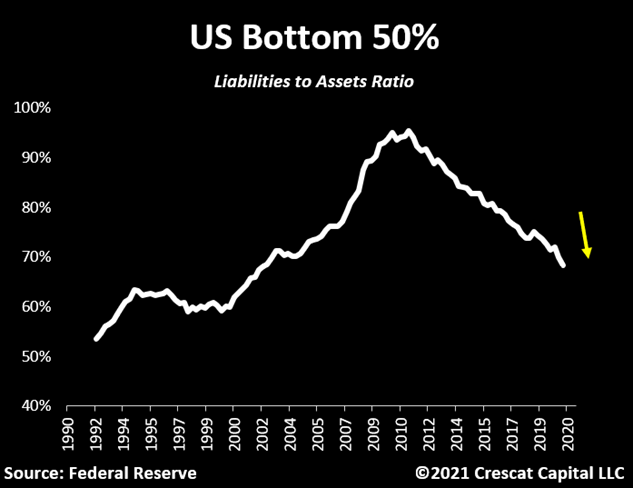
Balance sheets also look stronger. The liability to asset ratio for the bottom 50% is now at its lowest level in over a decade.
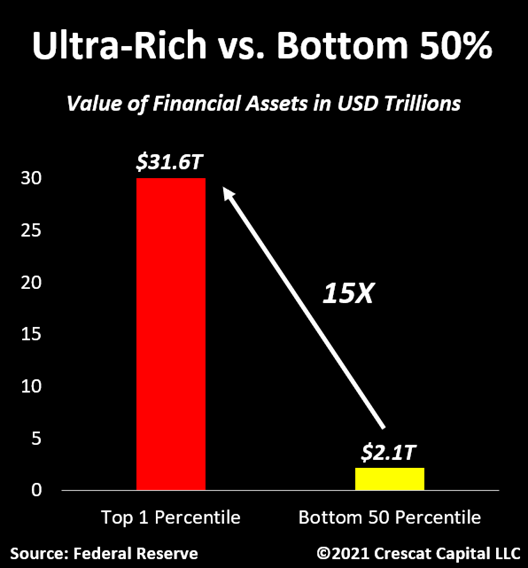
The top 1% holds over 15 times more financial assets than the bottom 50% and have also benefitted tremendously from recent easy money policies.
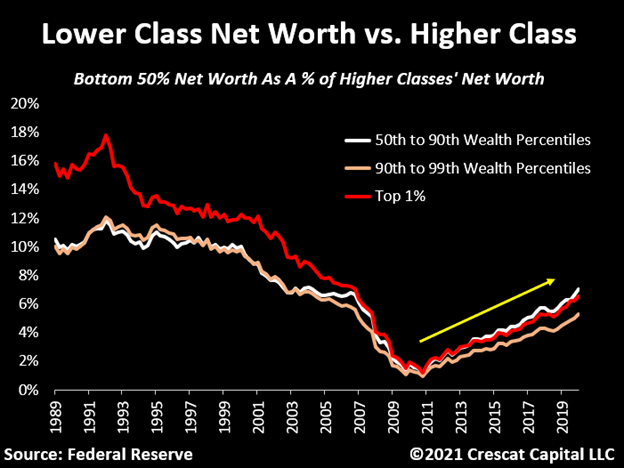
The bottom 50% of net worth has actually been improving relative to almost all other richer parts of society for the last 10 years.
The bigger point is that the recent improvements in the bottom 50% net worth have certainly nothing to do with vibrant macro conditions. It is quite the opposite. Corporate earnings are depressed. Economic activity remains well below its historical average with 18.4 million people claiming unemployment insurance benefits.
Nonetheless, what we have seen is a major wealth transfer from the government to the people. Just from January to July of 2020, the bottom 50% increased their net worth by $403 billion, the 50th to 90th wealth percentiles by $2.4 trillion, the 90th to 99th by $4.1 trillion, and the top 1% by $4.7 trillion. In aggregate, the US total population wealth increased by $11.8 trillion in 6 months!
Thinking today’s monetary and fiscal policies will have the same social and economic consequences that we had after the GFC is wrong in our view. We believe that a significant ramp up in consumer spending by the bottom 50%, along with the wealthier classes, will indeed fuel inflationary forces. When combined with a looming commodity supply shortage problem, the setup resembles the macro environment we had in the 1970s.
Modern Monetary Theory
The cost of this transfer of wealth into the pockets of the broad population is that public debt has shot up to $27 trillion. The government needs the party to go on, but someone has got to pay for it. For now, that is being accomplished with the highest levels of deficit spending since World War II and a government debt time bomb that is ticking faster.

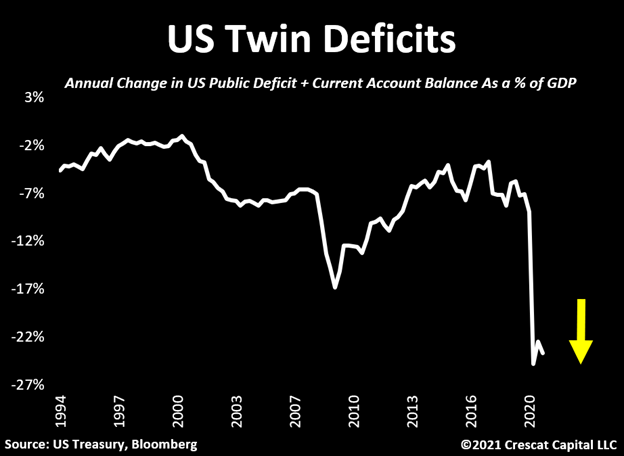
The twin current account and fiscal deficits are almost certain to continue with the blue wave to add to this government debt pile. The trade balance just reached its worst level since August 2006. On an annual basis, the US imported $650B more than it exported of goods and services. In combination with fiscal spending that is currently at World War II levels, the US twin deficit problem now represents close to 25% of its nominal GDP.
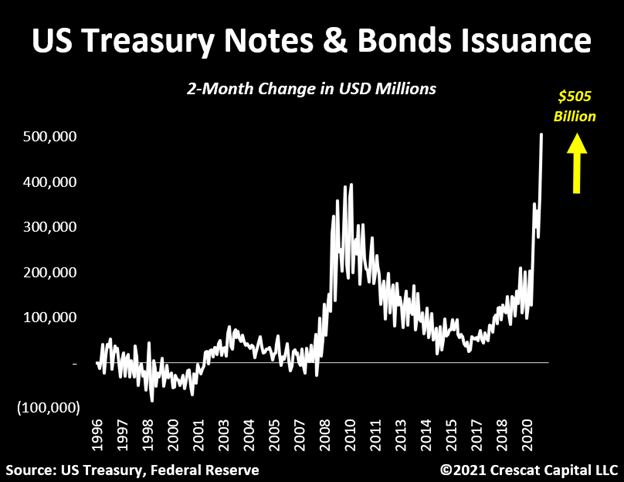
In November and December, the government issued $505B worth of Treasury notes and bonds. This was the largest 2-month issuance ever. The Fed bought 28% of that amount while US banks bought 20% of it. There is no way back from what we are seeing today. Debt monetization has clearly become the primary funding tool for the government.
Silver, the Cheapest Metal on Earth
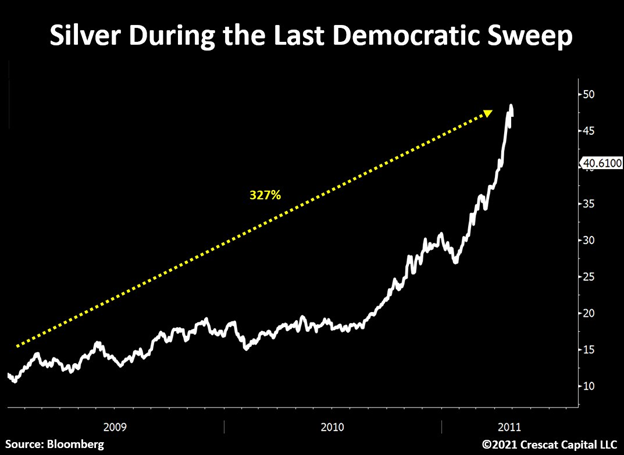
With the new Democratic leadership in place, we believe fiscal extravagance is here to stay. The last time we had such a sweep across the White House and Congress was in early 2009. It is important to note that the precious metals markets took off at that time to have one of their best runs in history over the next two and a half years. As the chart shows, silver went up by 327%. We think the macro setup for gold and silver, and related mining stocks, is even more compelling today. The economy has a major debt imbalance that is now compounding at an incredibly fast pace due to a fiscal and current account deficit problem. In addition, financial markets are tightly dependent on Fed policies to continue to suppress interest rates to allow institutions to service their debt and prevent risky assets from collapsing from historic valuations.
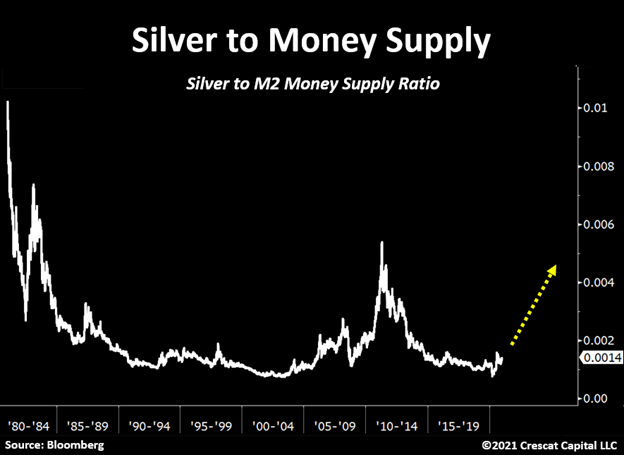
The recent precious metals selloff presents an incredible opportunity for investors in our view. The big macro picture remains unchanged. Silver, for instance, is still historically undervalued relative to money supply.
US Corporate Debt and Equity Market Excess
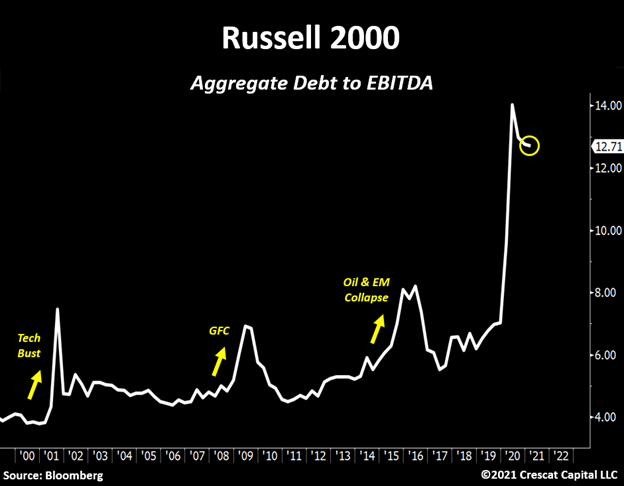
Public debt is not the only problem. Corporate debt is also at historic levels. More specifically, it amazes us how levered small cap stocks are today. They are currently trading at almost 13x Debt to EBITDA.
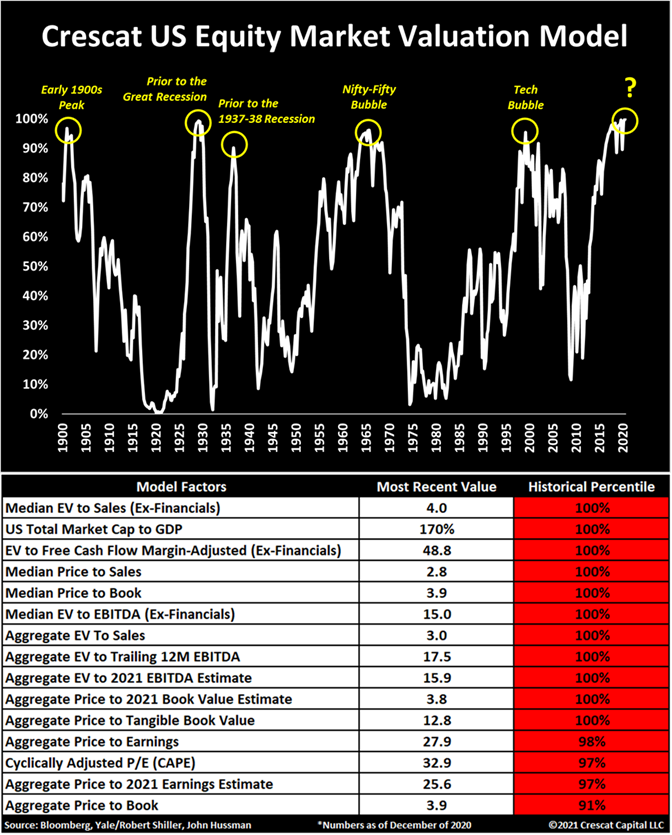
We believe the Fed is currently running a live experiment: how high can rates move up until stocks start running into trouble? Given the sheer magnitude of the valuation imbalance we have today, we believe nominal interest rates do not have a lot of room to rise and continue to justify stocks at these multiples. According to Crescat’s 15-factor valuation model for US equities, stocks have never been so expensive. Now we ask, at what point will the recent rise in inflationary forces become a headwind for these excessive prices across risky assets?
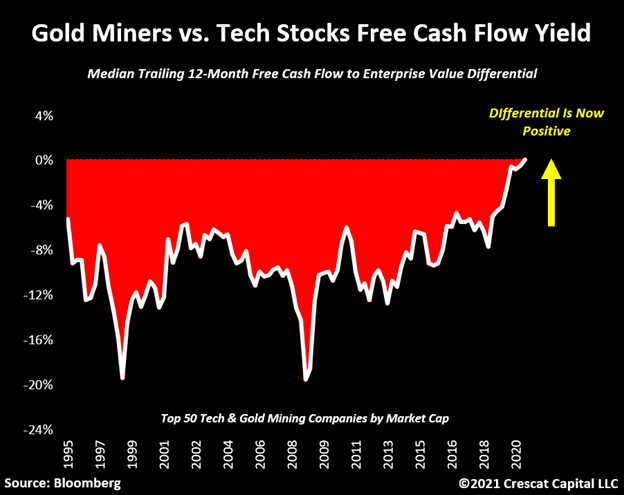
A significant part of our bullish case for precious metal miners is the valuation of the top producers relative to not only the overall equity market but especially in comparison with high-flying growth stocks. For the first time in 25 years, gold and silver mining companies now trade with a higher free cash flow yield than tech stocks. We believe this truly is a new era for precious metals’ companies that for a long time have been labeled as capital destroyers.
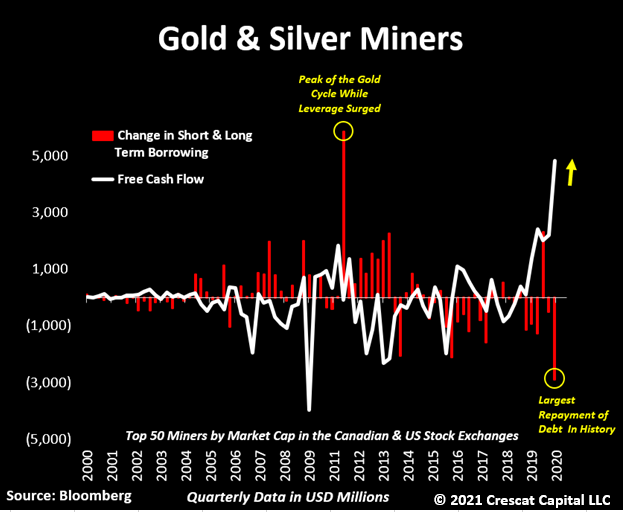
To recall from prior letters, this is the first time in history that precious metals miners used over 60% of their free cash flow generated in a quarter to pay down debt. This capital management decision resulted in the largest repayment of debt we have seen in the industry’s history. We think long-lasting skeptics of these businesses are about to miss one of the best macro-opportunities ever presented.
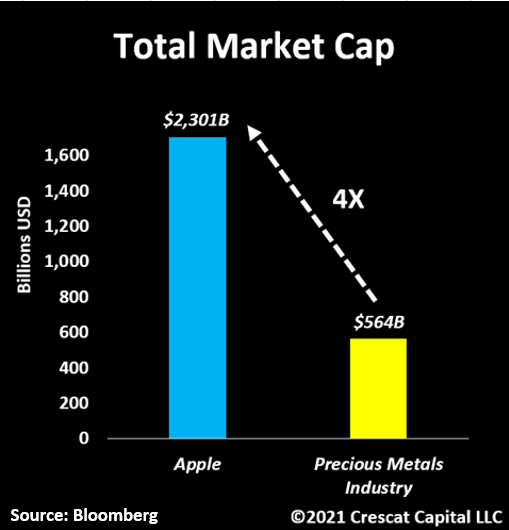
There is nothing better to illustrate the level of opportunity for being long precious metals trades today than the chart below. Apple’s market cap is now worth 4 times more than the entire precious metals industry. This is one of the most asymmetric investment theses we have seen in our careers.
The Great Rotation
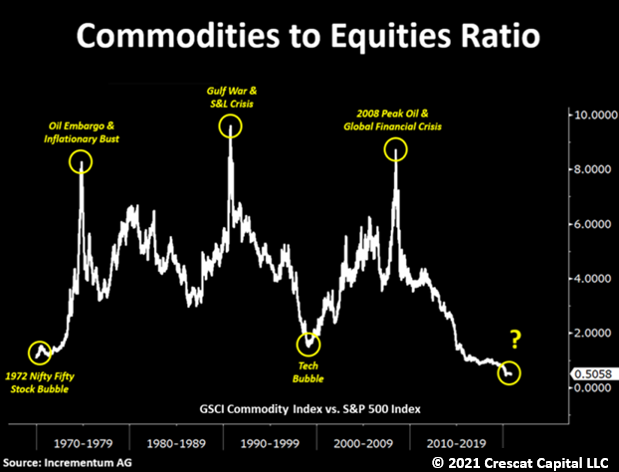
If we could only focus in one chart for the next three to five years, it would be the following. For us, the opportunity of buying historically undervalued commodity related assets while hedging our exposure by shorting overhyped equities is compelling.
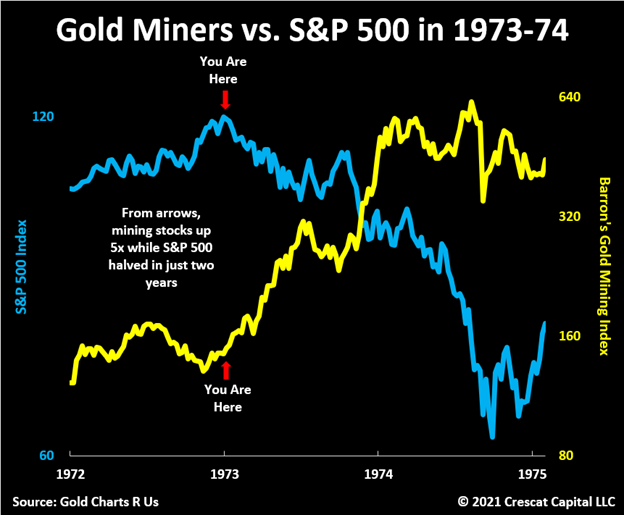
The opportunity for buying gold stocks and selling overvalued large cap growth stocks appears like 1972. In just two years in 1973-74, the S&P 500 declined 50% while gold stocks increased five-fold!
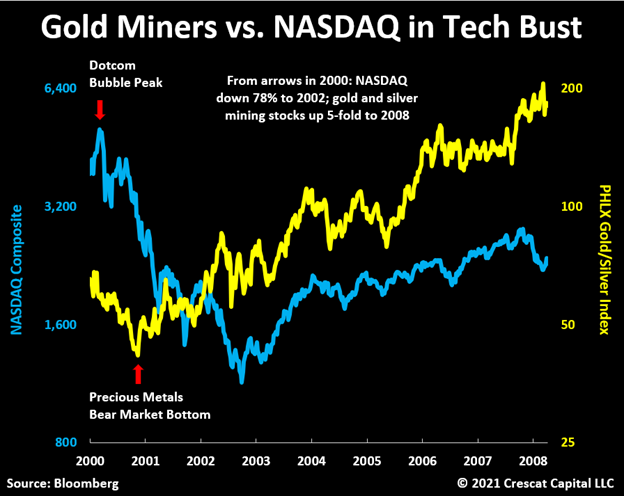
Similarly, from the peak of the tech bubble, the NASDAQ Composite declined 78% in just two and half years while gold and silver mining equites would soon begin a new secular bull market.
Crowded Emerging Markets Trade Could Miss the Mark
Oftentimes investors tend to pile into popular investment ideas at the exact wrong time of the market. We think that is the case with emerging markets today. The bullish thesis evolves around buying assets at cheap multiples with tremendous potential for growth. To be fair, that has always been the constructive view for emerging markets. However, for some strange reason, they never end up ‘emerging’ into developed economies.
Still at very early stages, investors are warming up to the idea of owning hard assets to protect and grow capital. As a result, emerging market stocks are being bid up as way of diversifying away from the dollar in addition to getting exposure to a rise in commodity prices. In our strong view, this is a risky way to be positioned. Like almost all asset classes, emerging market stock prices and FX crosses are detached from economic reality today. The current bets against the US dollar are crowded and ripe for reversal. We think emerging markets will suffer from a dollar short squeeze as investors are forced to de-risk. Our bullishness on gold does not mean we are bearish on the US dollar. We believe all fiat currencies are in a race to the bottom, but the US dollar remains among the strongest. In our global macro fund, to hedge our long gold exposure, we look for ways to be short the most overvalued currencies we can find, hence our Chinese yuan and Hong Kong dollar puts.
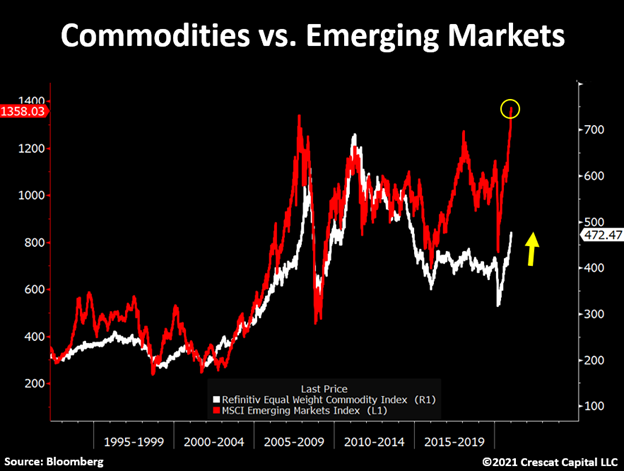
The chart below shows how commodities have massively lagged versus the rise of the MSCI Emerging Markets Index in the last years, now at all-time highs. This divergence puts into perspective how only one of those two assets looks to be an asymmetric opportunity for the years ahead – commodities. For those looking for hard asset exposure, we do not think it is the right time to be complicating this investment thesis with a crowded knock-on effect trade.
Oil Also Attractive
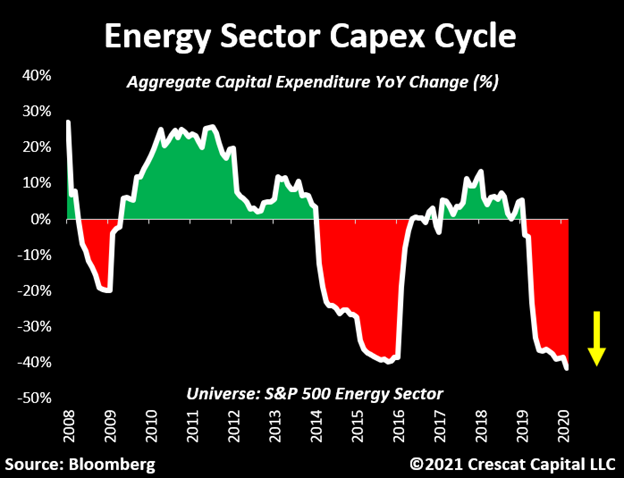
Oil is also incredibly mispriced in our view. The same way the precious metals mining industry is reluctant to spend capital, oil companies are perhaps even more so. Aggregate CAPEX for the S&P 500 energy sector is now falling at its steepest level in the last 12 years. Just like gold and silver, lack of investments in the industry will likely cause major long-term implications in the supply of oil. To build upon the thesis, the Democratic sweep only adds fuel to the oil fire. We see these factors as incredibly bullish for WTI.
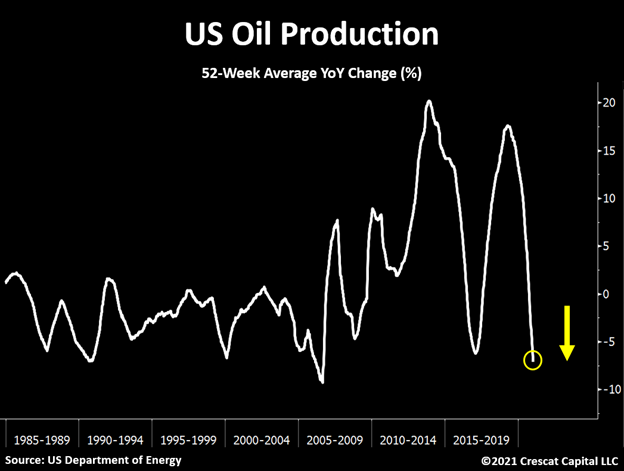
Along with the recent production cuts by OPEC of 1 million barrels a day, US oil production is also in free fall.
Same goes for drilling rigs. As we noted in our latest letter, the rig count cyclicality has been an incredibly reliable contrarian forward looking indicator for oil prices. Prior historical dips also preceded key market bottoms in WTI prices and oil and gas stocks.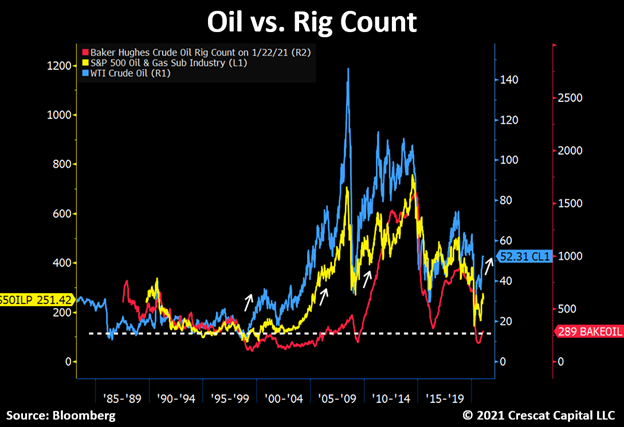
Crescat’s Activist Precious Metals Strategy
At Crescat, we believe a refined activist portfolio of gold and silver exploration equities represents one of the best combinations of value and intermediate-term upside appreciation potential in the financial markets today. We have identified select opportunities to deploy capital and unlock value seeking to transform premier global small cap explorers into mid and large cap miners. Expert technical guidance is key to unlocking value in the precious metals industry. Crescat is pleased to be advised by world-renowned exploration geologist Quinton Hennigh, PhD. We encourage you to reach out to Marek and Cassie, contact information below, to learn more.
Q4 Profit Attribution
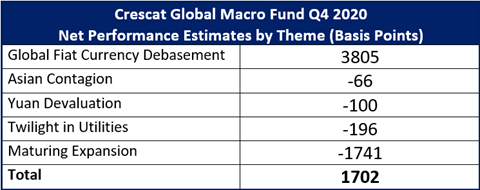
Performance
