With another earnings season upon us, leveraged ETF traders can look forward to periods of both opportunity and risk as
volatility reaches its quarterly pitch.
While the unpredictable influence of these reports amplifies the need for precise management of these vehicles, the sharp swings
possible in both directions make for great trading opportunities. As we head into the Q2 earnings season, we thought we’d take a
look back at how a few of the largest leveraged ETFs behaved through past seasons.
Financials
One of earliest sectors to report each season is the financials, which have recently seen a fair mix of good and mediocre
returns as interest rates slowly rise. Taking a look at the first quarter report schedule for a few of the companies that make up
the largest portion of the Direxion Daily Financial Bull 3X Shares (NYSEARCA: FAS) and Direxion Daily
Financial Bear 3X Shares (NYSEARCA: FAZ). This includes JPMorgan Chase & Co. (NYSE: JPM), Berkshire Hathaway Inc. (NYSE:
BRK.A), Wells Fargo & Co (NYSE: WFC), Citigroup Inc (NYSE: C), and Visa Inc (NYSE: V)
Below is the chart for Direxion’s Financial Bull 3x ETF covering the first quarter reporting period for these companies.

The performance data quoted represents past performance. Past performance does not guarantee future results.
You can see price was fairly reactive during the actual reporting days, and volume activity in the fund remained high for the
initial cluster of reports. However, as volume decreased after the span between JPM and V’s reports, FAS tended to gap upward. A
similar, but more muted volume trend can be seen in the inverse when looking at the Direxion 3x bear ETF.

Past performance does not guarantee future results.
Energy
Another early reporting sector, the oil production companies covered by the Direxion Daily Energy Bull and Bear 3x Shares
incorporate large positions in Exxon Mobil Corporation (NYSE: XOM), Chevron Corporation (NYSE: CVX), Schlumberger Limited (NYSE: SLB) and ConocoPhillips (NYSE: COP). Below is the chart for Direxion Daily Energy Bull 3X
Shares (BMV: ERX) over the course of the energy reporting period.

Past performance does not guarantee future results.
One thing of note in this chart is the ebb and flow in volume activity within the ETF before during and after each of the major
reporting dates. This rush in activity in-between reports, followed by lulls during their delivery, underlie a fairly stable price
over the two-week span in which the reports were delivered.
Some of this caution within the sector could be a result of a downtrend in oil prices that became a major focus during this
period. While most of the highlighted companies showed mixed results for the quarter, sentiment in the sector was generally
middling overall.
This theory might also be borne out by the heightened investor activity in the Direxion Daily Energy Bear 3X
Shares (BMV:ERY) for the same span, seen below.

Past performance does not guarantee future results.
Through most of the season, volume, though overall lower than in the bull ETF, retained a more stable level through the heart of
the report deliveries, with less significant valleys.
Technology
Finally, the tech sector’s prior earnings reactivity as seen through Direxion Daily Technology Bull 3X
Shares (BMV: TECL) and Direxion Daily Technology Bear 3X Shares (BMV: TECS) reveals
the steady upside in stocks like Apple Inc. (NASDAQ: AAPL), Alphabet Inc (NASDAQ: GOOGL), Microsoft Corporation (NASDAQ: MSFT) and others after a strong quarter that saw the Nasdaq
Inc (NASDAQ: NDAQ) composite grow by nearly 10
percent. Below is the chart showing the range of the top four positions within the fund during and after their deliveries.

Past performance does not guarantee future results.
Again, as major Nasdaq components, these stocks had already performed, on average, extremely well over the quarter. That
indication may account for the high volume leading into the initial reports and the upward momentum following the small sell-off
that occurred on Alphabet and Microsoft’s reports. Ranges in the ETF remained narrow after initially gapping up and stayed near a
dollar range through the reports.
So, what does this tell us? That leveraged ETFs, particularly the ones focused on sectors, can be especially volatile through
earnings periods. While equity trades can get a little crowded, these funds could offer an opportunity for those looking to capture
immediate alpha with short-term trades.

* The Net Expense Ratio includes management fees, other operating expenses and Acquired Fund Fees and Expenses. If Acquired
Fund Fees and Expenses were excluded, the Net Expense Ratio would be 0.95%. The Funds’ Adviser, Rafferty Asset Management, LLC
(“Rafferty”) has entered into an Operating Expense Limitation Agreement with each Fund, under which Rafferty has contractually
agreed to cap all or a portion of its management fee and/or reimburse each Fund for Other Expenses through September 1, 2018, to
the extent that the Fund’s Total Annual Fund Operating Expenses exceed 0.95% of the Fund’s daily net assets other than the
following: taxes, swap financing and related costs, acquired fund fees and expenses, dividends or interest on short positions,
other interest expenses, brokerage commissions and extraordinary expenses. If these expenses were included, the expense ratio would
be higher.
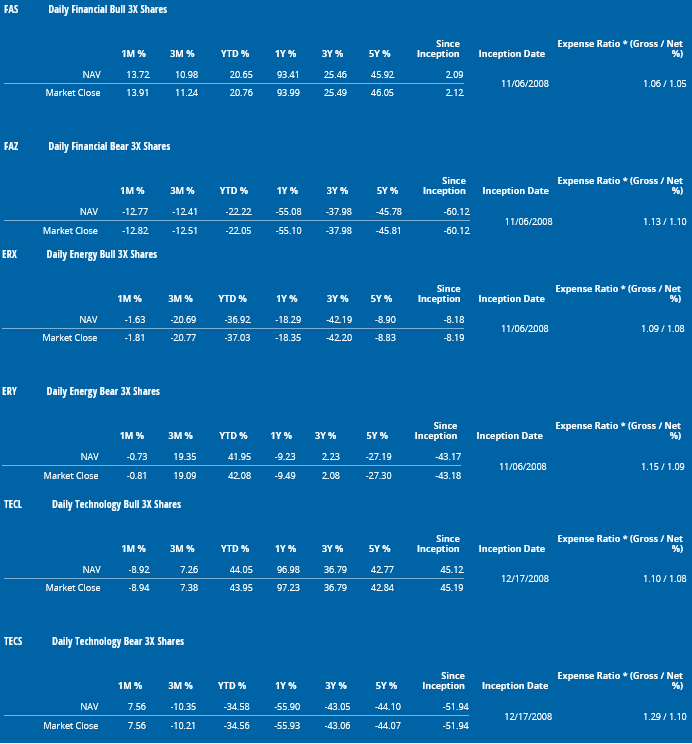
The performance data quoted represents past performance. Past performance does not guarantee future results. The investment
return and principal value of an investment will fluctuate. An investor’s shares, when redeemed, may be worth more or less than
their original cost. Current performance may be lower or higher than the performance quoted. Returns for performance under one year
are cumulative, not annualized. For the most recent month-end performance please visit the funds website at
direxioninvestments.com.
Standardized performance as of June 30, 2017
Disclaimers for the funds mentioned above can be found here.
Regulatory filings can be found here.
© 2017 Benzinga.com. Benzinga does not provide investment advice. All rights reserved.