- Fourth quarter revenue increases to $38 million, up 41% from fourth quarter 2019
- Record fourth quarter GBV of $166 million, up 44% from fourth quarter 2019
- Fourth quarter new bookings of 215,000, up 30% from fourth quarter 2019
SEATTLE, March 07, 2022 (GLOBE NEWSWIRE) -- Rover Group, Inc. (“Rover”) (NASDAQ: ROVR), the world’s largest online marketplace for pet care, today announced financial results for the fourth quarter and full year ended December 31, 2021.
“I am thrilled with the results our team delivered in a challenging and unpredictable year. We ended 2021 performing better than expected across key metrics such as revenue, unit economics, and Adjusted EBITDA,” said Rover co-founder and CEO, Aaron Easterly. “While we now believe pandemic dynamics will persist well into 2022, we still expect it to be a banner year.”
Unless otherwise noted, all comparisons for Q4 2021 and full year 2021 are relative to 2019 due to the irregularity in Rover’s 2020 business metrics caused by COVID.
Fourth Quarter 2021 Highlights:
- Revenue increased 41% to $38.0 million, compared to $27.0 million. Despite Omicron driven cancellations, this was Rover’s largest revenue quarter ever.
- Gross bookings value (GBV) grew 44% to $166.0 million, compared to $115.3 million.
- New and Repeat Bookings had record quarters with Total Bookings increasing 10% to 1.2 million, compared to 1.1 million. New bookings increased 30% to 215,000, compared to 165,000. Repeat bookings increased 6% to 998,000, compared to 941,000.
- New customer acquisition efficiency continued, with Customer acquisition cost (CAC) of $13, compared to $42 in Q4 2019.
- GAAP net income of $33.9 million, compared to a GAAP net loss of $13.4 million, as the result of a $39.7 million non-cash fair value adjustment for warrant and earnout liabilities tied to the SPAC transaction.
- Adjusted EBITDA of $7.6 million, marking Rover’s third consecutive quarter of positive Adjusted EBITDA. The Q4 result was an improvement of $15.9 million from the fourth quarter of 2019 as a result of strong revenue performance paired with a high volume of organic new customer acquisition and ongoing operational efficiencies.
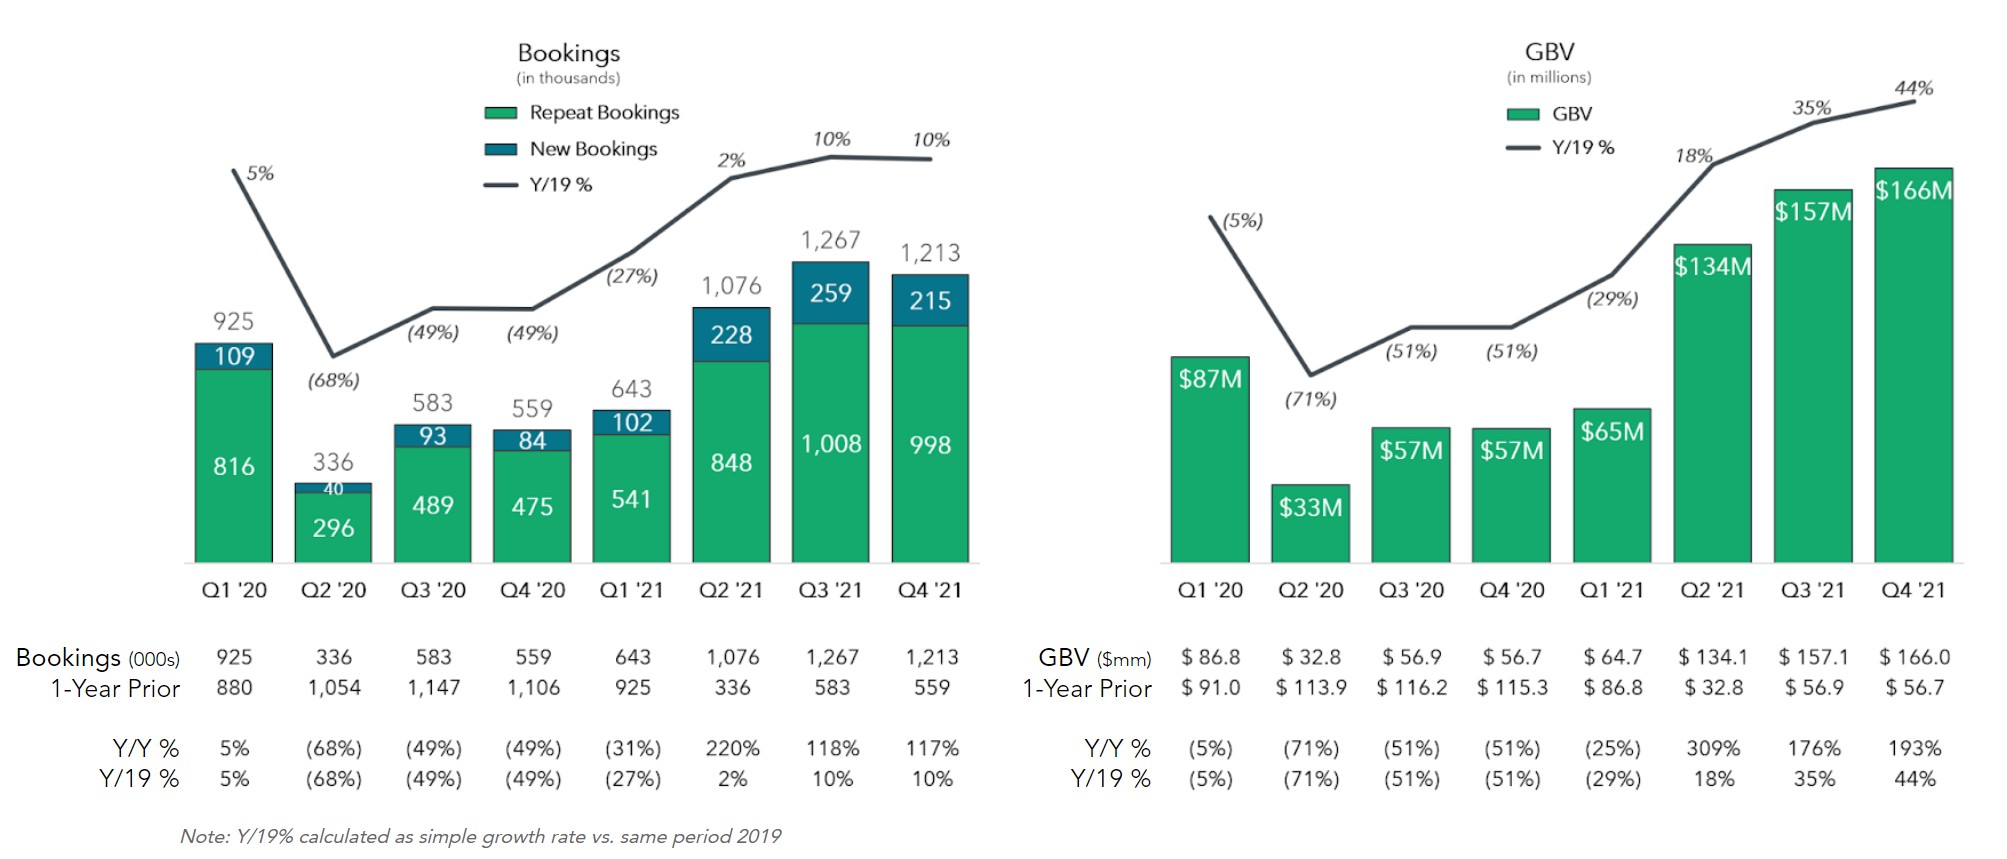
Growth in GBV represents increasing activity on our platform from repeat and new pet parents and may differ from bookings growth depending on the mix of daytime and overnight services for each period.
A chart accompanying this announcement is available at https://www.globenewswire.com/NewsRoom/AttachmentNg/add6769c-5b66-4e0f-ada0-f07877b597d6
Full Year 2021 Highlights:
- Revenue increased 16% to $109.8 million, compared to $95.1 million.
- GBV grew 20% to $521.9 million, compared to $436.4 million.
- New bookings increased 21% to 804,000, compared to 663,000.
- GAAP net loss of $64.0 million, compared to a GAAP net loss of $51.7 million, as the result of a ($43.9) million non-cash fair value adjustment for warrant and earnout liabilities tied to the SPAC transaction.
- Adjusted EBITDA of $12.4 million, an improvement from negative Adjusted EBITDA of $35.2 million. The increase was a result of strong revenue performance paired with a high volume of organic new customer acquisition and ongoing operational efficiencies.
- Cash from operations of $14.3 million, ending the year with $278.9 million of cash and cash equivalents.
First Quarter and Full Year 2022 Guidance
“While we continue to manage for long-term profitability and enterprise value, the recent gains in efficiencies and Adjusted EBITDA demonstrate our strong operating leverage as the business scales,” said Tracy Knox, CFO. “We are very optimistic about the growth in the business, our healthy financial trajectory, and the opportunity in front of us. Our outlook for 2022 balances our strong recent performance of accelerated revenue growth and new customer additions with continued uncertainty in the travel recovery.”
First Quarter 2022
- Revenue
- Rover anticipates revenue in the range of $25 - $27 million, a year-over-year increase of 113% at the midpoint of the projected range.
- Adjusted EBITDA
- Rover anticipates Adjusted EBITDA in the range of ($5) - ($7) million.
Full Year 2022
- Revenue
- Rover anticipates revenue in the range of $160 - $180 million, a year-over-year increase of 55% at the midpoint of the projected range.
- Adjusted EBITDA
- Rover anticipates Adjusted EBITDA in the range of $17- $21 million.
With respect to guidance, which includes the Q1 and full year impact from Omicron, the pandemic has persisted longer than we had originally anticipated and continues to bring some level of uncertainty in the near and medium term. As such, the low end of full year guidance anticipates material impact from potential Covid waves while the high end assumes an ongoing modest impact.
Rover also announced today in a separate release, that its Board of Directors, as part of its CFO succession planning, has identified Charlie Wickers, Rover’s Vice President of Finance, as successor Chief Financial Officer to Tracy Knox. Ms. Knox will continue as CFO through August 2022, by which time she will have served as Rover’s CFO for nearly five years, and will remain on staff as an advisor through her retirement at the end of the year.
About Rover
Founded in 2011 and based in Seattle, Rover (Nasdaq: ROVR) is the world’s largest online marketplace for pet care. Rover connects pet parents with pet providers who offer overnight services, including boarding and in-home pet sitting, as well as daytime services, including doggy daycare, dog walking, and drop-in visits. To learn more about Rover, please visit https://www.rover.com.
Conference Call and Webcast Information
Rover will host a conference call today at 1:30 p.m. PT (4:30 p.m. ET) to discuss the fourth quarter and full year 2021 financial results and provide commentary on business performance. The conference call may be accessed by dialing (833) 714-3266 for U.S./Canadian callers or (360) 562-9905 for international callers. Once connected with the operator, please provide the conference ID of 4480574. The live webcast can be accessed at https://investors.rover.com/, along with this earnings press release. A webcast replay will be available at the same address shortly after the conclusion of the live event and will be accessible for at least 90 days. This call will contain forward-looking statements and other material information regarding Rover’s financial and operating results.
Rover uses its Investor Relations website at https://investors.rover.com as a means of disclosing material non-public information and for complying with its disclosure obligations under Regulation FD. Accordingly, investors should monitor Rover’s Investor Relations website, in addition to following Rover’s press releases, SEC filings, public conference calls and webcasts.
Forward Looking Statements
This press release contains forward-looking statements within the meaning of the Private Securities Litigation Reform Act of 1995 including, but not limited to, Rover’s expectations or predictions of future financial or business performance or conditions, statements regarding COVID recovery, changes in travel and working behavior, and the impact on Rover’s business and operating results. Generally, statements that are not historical facts, including statements concerning possible or assumed future actions, business strategies, events, or results of operations, including 2022 guidance and projections, are forward-looking statements. The words “believe,” “may,” “will,” “estimate,” “continue,” “anticipate,” “intend,” “expect,” “could,” “would,” “project,” “plan,” “potentially,” “preliminary,” “likely,” and similar expressions are intended to identify forward-looking statements. Such forward-looking statements involve risks, uncertainties and assumptions that may cause actual events, results, or performance to differ materially from those indicated by such statements. Certain of these risks are identified in the sections titled “Risk Factors” and “Management’s Discussion and Analysis of Financial Condition and Results of Operations” in Rover’s SEC filings, including, but not limited to, the final prospectus filed with the SEC on November 22, 2021 and Rover’s Annual Report on Form 10-K to be filed for the year ended December 31, 2021. Additional factors that could cause actual results to differ materially from those expressed or implied in forward-looking statements can be found in Rover’s other recent filings with the SEC which are available, free of charge, on the SEC’s website at www.sec.gov. If the risks or uncertainties ever materialize or the assumptions prove incorrect, Rover’s results may differ materially from those expressed or implied by such forward-looking statements. Forward-looking statements speak only as of the date they are made. Except as required by law, Rover assumes no obligation and does not intend to update any forward-looking statements or to conform these statements to actual results or changes in Rover’s expectations.
Definitions
- A booking is defined as a single arrangement, prior to cancellation, between a pet parent and pet care provider, which can be for a single night or multiple nights for our overnight services, or for a single walk/day/drop-in or multiple walks/days/drop-ins for our daytime services. New bookings is defined as the total number of first-time bookings that new users, which Rover refers to as pet parents, book on our platform in a period. Repeat bookings are defined as the total number of bookings from pet parents who have had a previous booking on Rover.
- Gross Booking Value, or GBV, represents the dollar value of bookings on our platform in a period and is inclusive of pet care provider earnings, service fees, add-ons, taxes and alterations that occurred during that period.
- Customer acquisition cost, or CAC, for any period is defined as advertising expenses less brand, content and marketing tools divided by in-period new bookings.
- Yo19% is calculated as the non-compounding growth rate of the current period metric vs. that of the same period in 2019.
Non-GAAP Financial Measures
To provide investors with additional information regarding our financial results, Rover has disclosed in this earnings release Adjusted EBITDA and Adjusted EBITDA margin, both of which are non-GAAP financial measures. Reconciliation of Adjusted EBITDA to the most comparable GAAP measure, net income (loss), is contained in tabular form below. Adjusted EBITDA is defined as net loss excluding depreciation and amortization, stock-based compensation expense, interest expense, interest income, change in fair value, net, other income (expense), net, income tax expense or benefit, and non-routine items such as restructuring, investment impairment, certain merger and acquisition-related and transaction-related costs. Adjusted EBITDA margin as presented in the reconciliation table below is Adjusted EBITDA divided by revenue.
We use Adjusted EBITDA and Adjusted EBITDA margin for financial and operational decision-making and as a means to evaluate period-to-period comparisons. We consider Adjusted EBITDA and Adjusted EBITDA margin to be important measures because they help illustrate underlying trends in our business and our historical operating performance on a more consistent basis. We believe that Adjusted EBITDA, when taken together with its most directly comparable GAAP measure, net income (loss), provides meaningful supplemental information regarding our performance by excluding certain items that may not be indicative of our recurring core business operating results.
We believe that both management and investors benefit from referring to these non-GAAP financial measures in assessing our performance and when planning, forecasting, and analyzing future periods. These non-GAAP financial measures also facilitate management’s internal comparisons to our historical performance. We believe these non-GAAP financial measures are useful to investors both because (1) they allow for greater transparency with respect to key metrics used by management in its financial and operational decision-making and (2) they are used by our institutional investors and the analyst community to help them analyze the health of our business. Accordingly, we believe that these non-GAAP financial measures provide useful information to investors and others in understanding and evaluating our operating results in the same manner as our management team and board of directors.
Non-GAAP financial measures have limitations as an analytical tool, and you should not consider them in isolation, or as a substitute for, financial information prepared in accordance with GAAP. For example, Adjusted EBITDA does not reflect our cash expenditures or future requirements for capital expenditures or contractual commitments and does not reflect changes in, or cash requirements for, our working capital needs. Further, our calculation of Adjusted EBITDA may differ from similarly titled non-GAAP measures, if any, reported by our peer companies, or our peer companies may use other measures to calculate their financial performance, and therefore our use of Adjusted EBITDA may not be directly comparable to similarly titled measures of other companies. The principal limitation of Adjusted EBITDA is that it excludes significant expenses and income that are required by GAAP to be recorded in our financial statements. In addition, it is subject to inherent limitations as it reflects the exercise of judgments by management about which expense and income are excluded or included in determining this non-GAAP financial measure. In order to compensate for these limitations, management presents non-GAAP financial measures in connection with GAAP results. In addition, such financial information is unaudited and does not conform to SEC Regulation S-X and as a result such information may be presented differently in our future filings with the SEC. For example, due to warrant and earnout liabilities resulting from the merger, we now exclude change in fair value, net from net loss in our Adjusted EBITDA calculation, which had not been done in prior periods and will have less impact on the calculations for future periods due to their reclassification to equity as of December 31, 2021 for the earnout shares and in January 2022 for the warrants. Moreover, the year ended December 31, 2020 calculations exclude an impairment loss not reflected in other years and the year and quarter ended December 31, 2021 calculations exclude expenses related to a secondary offering not reflected in other years.
Our 2022 guidance also includes Adjusted EBITDA. Due to the forward-looking nature of these projections, specific quantifications of the amounts that would be required to reconcile such projections to GAAP measures cannot be reasonably calculated or predicted at this time without unreasonable efforts and Rover’s management believes that it is not feasible to provide accurate forecasted non-GAAP reconciliations. For example, the non-GAAP adjustment for stock-based compensation expense requires additional inputs such as number of shares granted and market price that are not currently ascertainable.
ROVER GROUP, INC.
Key Business Metrics
(Bookings in thousands, GBV in millions)
(unaudited) |
|
|
|
|
|
|
|
|
|
|
|
|
|
|
|
Three Months Ended
December 31, |
|
Year Ended
December 31, |
|
|
2021 |
|
2020 |
|
2019 |
|
2021 |
|
2020 |
|
2019 |
| Bookings: |
|
|
|
|
|
|
|
|
|
|
|
|
| New bookings |
|
|
215 |
|
|
84 |
|
|
165 |
|
|
804 |
|
|
326 |
|
|
663 |
| Repeat bookings |
|
|
998 |
|
|
475 |
|
|
941 |
|
|
3,395 |
|
|
2,076 |
|
|
3,524 |
| Total bookings |
|
|
1,213 |
|
|
559 |
|
|
1,106 |
|
|
4,199 |
|
|
2,042 |
|
|
4,187 |
| GBV |
|
$ |
166.0 |
|
$ |
56.7 |
|
$ |
115.3 |
|
$ |
521.9 |
|
$ |
233.2 |
|
$ |
436.4 |
ROVER GROUP, INC.
Condensed Consolidated Statements of Operations
(in thousands, except per share data)
(unaudited)
|
Three Months Ended
December 31, |
|
Year Ended
December 31, |
|
2021 |
|
2020 |
|
2021 |
|
2020 |
| Revenue |
$ |
38,006 |
|
|
$ |
13,168 |
|
|
$ |
109,837 |
|
|
$ |
48,800 |
|
| Costs and expenses: |
|
|
|
|
|
|
|
| Cost of revenue (exclusive of depreciation and amortization shown separately below) |
8,042 |
|
|
3,874 |
|
|
26,536 |
|
|
19,823 |
|
| Operations and support |
5,013 |
|
|
2,374 |
|
|
14,928 |
|
|
12,371 |
|
| Marketing |
6,405 |
|
|
2,433 |
|
|
19,937 |
|
|
16,332 |
|
| Product development |
8,126 |
|
|
4,474 |
|
|
22,712 |
|
|
22,567 |
|
| General and administrative |
14,293 |
|
|
6,052 |
|
|
35,559 |
|
|
21,813 |
|
| Depreciation and amortization |
1,754 |
|
|
1,932 |
|
|
7,327 |
|
|
8,899 |
|
| Total costs and expenses |
43,633 |
|
|
21,139 |
|
|
126,999 |
|
|
101,805 |
|
| Income (loss) from operations |
(5,627 |
) |
|
(7,971 |
) |
|
(17,162 |
) |
|
(53,005 |
) |
| Other income (expense), net: |
|
|
|
|
|
|
|
| Interest income |
22 |
|
|
5 |
|
|
49 |
|
|
488 |
|
| Interest expense |
(18 |
) |
|
(710 |
) |
|
(2,952 |
) |
|
(3,154 |
) |
| Loss from impairment of DogHero investment |
— |
|
|
(80 |
) |
|
— |
|
|
(2,080 |
) |
| Change in fair value of earnout liabilities |
25,304 |
|
|
— |
|
|
(46,015 |
) |
|
— |
|
| Change in fair value of derivative warrant liabilities |
14,350 |
|
|
— |
|
|
2,089 |
|
|
— |
|
| Other income (expense), net |
(91 |
) |
|
281 |
|
|
(284 |
) |
|
172 |
|
| Total other income (expense), net |
39,567 |
|
|
(504 |
) |
|
(47,113 |
) |
|
(4,574 |
) |
| Loss before income taxes |
33,940 |
|
|
(8,475 |
) |
|
(64,275 |
) |
|
(57,579 |
) |
| Benefit from (provision for) income taxes |
(55 |
) |
|
(28 |
) |
|
226 |
|
|
94 |
|
| Net income (loss) |
$ |
33,885 |
|
|
$ |
(8,502 |
) |
|
$ |
(64,049 |
) |
|
$ |
(57,485 |
) |
| Net income (loss) per share attributable to common stockholders, basic and diluted |
$ |
0.19 |
|
|
$ |
(0.28 |
) |
|
$ |
(0.72 |
) |
|
$ |
(1.92 |
) |
| Weighted-average shares used in computing net income (loss) per share, basic and diluted |
175,590 |
|
|
30,080 |
|
|
89,004 |
|
|
29,896 |
|
ROVER GROUP, INC.
Condensed Consolidated Balance Sheets
(in thousands, except per share data)
(unaudited)
|
December 31, |
|
2021 |
|
2020 |
| Assets |
|
|
|
| Current assets |
|
|
|
| Cash and cash equivalents |
$ |
278,904 |
|
|
$ |
80,848 |
|
| Short-term investments |
2,671 |
|
|
— |
|
| Accounts receivable, net |
26,023 |
|
|
2,992 |
|
| Prepaid expenses and other current assets |
6,113 |
|
|
3,629 |
|
| Total current assets |
313,711 |
|
|
87,469 |
|
| Property and equipment, net |
20,874 |
|
|
24,923 |
|
| Operating lease right-of-use assets |
21,495 |
|
|
— |
|
| Intangible assets, net |
4,469 |
|
|
7,967 |
|
| Goodwill |
33,159 |
|
|
33,159 |
|
| Deferred tax asset, net |
1,477 |
|
|
1,235 |
|
| Long-term investments |
1,621 |
|
|
— |
|
| Other noncurrent assets |
348 |
|
|
134 |
|
| Total assets |
$ |
397,154 |
|
|
$ |
154,887 |
|
| Liabilities, Redeemable Convertible Preferred Stock and Stockholders’ Equity (Deficit) |
|
|
|
| Current liabilities |
|
|
|
| Accounts payable |
$ |
5,043 |
|
|
$ |
1,301 |
|
| Accrued compensation and related expenses |
6,600 |
|
|
3,269 |
|
| Accrued expenses and other current liabilities |
3,021 |
|
|
2,747 |
|
| Deferred revenue |
3,077 |
|
|
751 |
|
| Pet parent deposits |
28,269 |
|
|
7,931 |
|
| Pet service provider liabilities |
10,894 |
|
|
6,140 |
|
| Debt, current portion |
— |
|
|
4,128 |
|
| Operating lease liabilities, current portion |
2,433 |
|
|
— |
|
| Total current liabilities |
59,337 |
|
|
26,267 |
|
| Deferred rent, net of current portion |
— |
|
|
2,248 |
|
| Debt, net of current portion |
— |
|
|
33,398 |
|
| Operating lease liabilities, net of current portion |
25,198 |
|
|
— |
|
| Derivative warrant liabilities |
19,943 |
|
|
— |
|
| Other noncurrent liabilities |
84 |
|
|
4,659 |
|
| Total liabilities |
104,562 |
|
|
66,572 |
|
| Commitments and contingencies |
|
|
|
| Redeemable convertible preferred stock, $0.00001 par value, no shares and 87,611 authorized as of December 31, 2021 and 2020, respectively; no shares and 90,814 shares issued and outstanding as of December 31, 2021 and 2020, respectively; aggregate liquidation preference of $294,802 as of December 31, 2020 |
— |
|
|
290,427 |
|
| Stockholders’ equity (deficit): |
|
|
|
| Preferred stock, $0.0001 par value, 10,000 and no shares authorized as of December 31, 2021 and 2020, respectively; no shares issued and outstanding as of December 31, 2021 and 2020, respectively |
— |
|
|
— |
|
| Common stock, $0.0001 par value, 990,000 and 144,250 shares authorized as of December 31, 2021 and 2020, respectively; 177,342 and 30,398 shares issued and outstanding as of December 31, 2021 and 2020, respectively |
18 |
|
|
3 |
|
| Additional paid-in capital |
612,680 |
|
|
53,909 |
|
| Accumulated other comprehensive income |
220 |
|
|
253 |
|
| Accumulated deficit |
(320,326 |
) |
|
(256,277 |
) |
| Total stockholders’ equity (deficit) |
292,592 |
|
|
(202,112 |
) |
| Total liabilities, redeemable convertible preferred stock and stockholders’ equity (deficit) |
$ |
397,154 |
|
|
$ |
154,887 |
|
ROVER GROUP, INC.
Condensed Consolidated Statements of Cash Flows
(in thousands)
(unaudited)
|
Year Ended December 31, |
|
2021 |
|
2020 |
| OPERATING ACTIVITIES |
|
|
|
| Net loss |
$ |
(64,049 |
) |
|
$ |
(57,485 |
) |
| Adjustments to reconcile net loss to net cash provided by (used in) operating activities: |
|
|
|
| Stock-based compensation |
11,061 |
|
|
5,541 |
|
| Depreciation and amortization |
14,683 |
|
|
18,713 |
|
| Non-cash operating lease costs |
2,062 |
|
|
— |
|
| Change in fair value of earnout liabilities |
46,015 |
|
|
— |
|
| Change in fair value of derivative warrant liabilities |
(2,089 |
) |
|
— |
|
| Net amortization (accretion) of investment premiums (discounts) |
— |
|
|
11 |
|
| Issuance of common stock warrants |
— |
|
|
— |
|
| Amortization of debt issuance costs |
712 |
|
|
841 |
|
| Deferred income taxes |
(272 |
) |
|
(303 |
) |
| Loss on disposal of property and equipment |
64 |
|
|
191 |
|
| Impairment of DogHero investment |
— |
|
|
2,080 |
|
| Changes in operating assets and liabilities: |
|
|
|
| Accounts receivable |
(23,024 |
) |
|
(519 |
) |
| Prepaid expenses and other current assets |
(3,126 |
) |
|
460 |
|
| Other noncurrent assets |
(24 |
) |
|
(59 |
) |
| Accounts payable |
3,738 |
|
|
(4,437 |
) |
| Accrued expenses and other current liabilities |
4,060 |
|
|
(3,177 |
) |
| Deferred revenue |
2,325 |
|
|
(1,736 |
) |
| Pet parent deposits |
20,338 |
|
|
(13,508 |
) |
| Pet service provider liabilities |
4,754 |
|
|
(5,320 |
) |
| Operating lease liabilities |
(2,307 |
) |
|
— |
|
| Other noncurrent liabilities |
(587 |
) |
|
1,752 |
|
| Net cash provided by (used in) operating activities |
14,334 |
|
|
(56,955 |
) |
| INVESTING ACTIVITIES |
|
|
|
| Purchases of property and equipment |
(881 |
) |
|
(910 |
) |
| Capitalization of internal-use software |
(6,340 |
) |
|
(6,757 |
) |
| Proceeds from disposal of property and equipment |
24 |
|
|
— |
|
| Purchases of available-for-sale securities |
(4,293 |
) |
|
(16,286 |
) |
| Proceeds from sales of available-for-sale securities |
— |
|
|
29,002 |
|
| Maturities of available-for-sale securities |
— |
|
|
23,450 |
|
| Proceeds from sale of DogHero investment |
— |
|
|
2,920 |
|
| Net cash (used in) provided by investing activities |
(11,490 |
) |
|
31,419 |
|
| FINANCING ACTIVITIES |
|
|
|
| Proceeds from exercise of stock options and issuance of common stock |
6,505 |
|
|
788 |
|
| Taxes paid related to settlement of equity awards |
(8,673 |
) |
|
— |
|
| Proceeds from reverse recapitalization and related financing |
268,282 |
|
|
— |
|
| Payment of deferred transaction costs related to reverse recapitalization |
(32,743 |
) |
|
— |
|
| Proceeds from borrowing on credit facilities |
— |
|
|
64,563 |
|
| Repayment of borrowings on credit facilities |
(38,124 |
) |
|
(26,439 |
) |
| Issuance costs related to debt financing |
— |
|
|
(281 |
) |
| Net cash provided by financing activities |
195,247 |
|
|
38,631 |
|
| Effect of exchange rate changes on cash and cash equivalents |
(35 |
) |
|
99 |
|
| Net increase (decrease) in cash and cash equivalents |
198,056 |
|
|
13,194 |
|
| Cash and cash equivalents, beginning of year |
80,848 |
|
|
67,654 |
|
| Cash and cash equivalents, end of year |
$ |
278,904 |
|
|
$ |
80,848 |
|
| SUPPLEMENTAL DISCLOSURE OF CASH FLOW INFORMATION |
|
|
|
| Cash paid for income taxes |
$ |
5 |
|
|
$ |
282 |
|
| Cash paid for interest |
2,511 |
|
|
2,073 |
|
| NON-CASH INVESTING AND FINANCING ACTIVITIES |
|
|
|
| Right-of-use assets obtained in exchange for lease liabilities (excluding those recognized upon initial adoption of ASC 842) |
$ |
757 |
|
|
$ |
— |
|
| Conversion of redeemable convertible preferred stock to common stock |
$ |
290,427 |
|
|
$ |
— |
|
| Earnout liability recognized upon the closing of the reverse recapitalization |
$ |
228,082 |
|
|
$ |
— |
|
| Derivative warrant liabilities recognized upon the closing of the reverse recapitalization |
$ |
22,032 |
|
|
$ |
— |
|
| Reclassification of earnout liabilities to additional paid-in-capital |
$ |
274,097 |
|
|
$ |
— |
|
| Issuance of Series G redeemable convertible preferred stock to settle Barking Dog Ventures, Ltd. holdback |
$ |
— |
|
|
$ |
62 |
|
| Issuance of common stock warrants under credit facility and subordinated credit facility agreements |
$ |
— |
|
|
$ |
657 |
|
ROVER GROUP, INC.
Adjusted EBITDA Reconciliation
(in thousands)
(unaudited)
|
Three Months Ended December 31, |
|
Year Ended December 31, |
|
|
2021 |
|
|
|
2020 |
|
|
|
2019 |
|
|
|
2021 |
|
|
|
2020 |
|
|
|
2019 |
|
|
|
|
|
|
|
|
|
|
|
|
|
| Revenue |
$ |
38,006 |
|
|
$ |
13,168 |
|
|
$ |
26,974 |
|
|
$ |
109,837 |
|
|
$ |
48,800 |
|
|
$ |
95,052 |
|
| Adjusted EBITDA reconciliation: |
|
|
|
|
|
|
|
|
|
|
|
| Net (loss) income |
$ |
33,885 |
|
|
$ |
(8,502 |
) |
|
$ |
(13,397 |
) |
|
$ |
(64,049 |
) |
|
$ |
(57,485 |
) |
|
$ |
(51,714 |
) |
| Add (deduct): |
|
|
|
|
|
|
|
|
|
|
|
| Depreciation and amortization (1) |
|
3,868 |
|
|
|
3,613 |
|
|
|
3,631 |
|
|
|
14,683 |
|
|
|
18,713 |
|
|
|
13,596 |
|
| Stock-based compensation expense (2) |
|
7,919 |
|
|
|
1,273 |
|
|
|
1,274 |
|
|
|
11,061 |
|
|
|
5,541 |
|
|
|
4,520 |
|
| Interest expense |
|
18 |
|
|
|
710 |
|
|
|
72 |
|
|
|
2,952 |
|
|
|
3,154 |
|
|
|
204 |
|
| Interest income |
|
(22 |
) |
|
|
(5 |
) |
|
|
(474 |
) |
|
|
(49 |
) |
|
|
(488 |
) |
|
|
(2,807 |
) |
| Loss from impairment of DogHero investment |
|
— |
|
|
|
80 |
|
|
|
— |
|
|
|
— |
|
|
|
2,080 |
|
|
|
— |
|
| Change in fair value, net (3) |
|
(39,654 |
) |
|
|
— |
|
|
|
— |
|
|
|
43,926 |
|
|
|
— |
|
|
|
— |
|
| Other (income) expense, net |
|
91 |
|
|
|
(281 |
) |
|
|
805 |
|
|
|
284 |
|
|
|
(171 |
) |
|
|
1,109 |
|
| Income tax (benefit) expense |
|
55 |
|
|
|
28 |
|
|
|
(181 |
) |
|
|
(226 |
) |
|
|
(94 |
) |
|
|
(468 |
) |
| Restructuring expense (4) |
|
— |
|
|
|
13 |
|
|
|
— |
|
|
|
— |
|
|
|
3,763 |
|
|
|
— |
|
| Merger and acquisition-related costs (5) |
|
220 |
|
|
|
— |
|
|
|
28 |
|
|
|
2,556 |
|
|
|
31 |
|
|
|
341 |
|
| Transaction-related expenses (6) |
|
1,263 |
|
|
|
— |
|
|
|
— |
|
|
|
1,263 |
|
|
|
— |
|
|
|
— |
|
| Adjusted EBITDA |
$ |
7,643 |
|
|
$ |
(3,071 |
) |
|
$ |
(8,242 |
) |
|
$ |
12,401 |
|
|
$ |
(24,956 |
) |
|
$ |
(35,219 |
) |
| Adjusted EBITDA margin (7) |
|
20 |
% |
|
|
(23 |
)% |
|
|
(31 |
)% |
|
|
11 |
% |
|
|
(51 |
)% |
|
|
(37 |
)% |
_________________
(1) Depreciation and amortization include amortization expense related to capitalized internal use software, which is recognized as cost of revenue (exclusive of depreciation and amortization shown separately) in the consolidated statements of operations.
(2) Stock-based compensation expense includes equity granted to employees as well as for professional services to non-employees.
(3) Change in fair value, net includes the mark-to-market adjustments related to the earnout and warrant liabilities.
(4) Restructuring costs include expenses for severance-related and legal costs incurred during the implementation of our restructuring plan.
(5) Merger and acquisition-related costs include accounting, legal, consulting and travel related expenses incurred in connection with the merger and business combinations.
(6) Transaction-related expenses include costs related to our secondary offering in the fourth quarter of 2021.
(7) Adjusted EBITDA margin is Adjusted EBITDA divided by revenue.
Contacts:
MEDIA
pr@rover.com
Kristin Sandberg
(360) 510-6365
INVESTORS
brinlea@blueshirtgroup.com
Brinlea Johnson
(415) 269-2645