CALGARY, Alberta, Aug. 10, 2022 (GLOBE NEWSWIRE) -- (PIPE – TSX) Pipestone Energy Corp. (“Pipestone” or the “Company”) is pleased to report its second quarter 2022 financial and operational results, and to provide an update on its operations.
SECOND QUARTER 2022 CORPORATE HIGHLIGHTS:
- The Company generated record revenue of $210.4 million, which represents more than a two and a half times increase over Q2 2021 revenue of $82.3 million, and a 37% increase from Q1 2022 revenue of $153.5 million;
- In Q2 2022, Pipestone achieved record average quarterly production totaling 30,770 boe/d (28% condensate, 41% total liquids), representing a 32% quarterly increase over Q2 2021 production of 23,336 boe/d (31% condensate, 46% total liquids), and a 12% increase over Q1 2022 production of 27,581 boe/d (29% condensate, 43% total liquids). In April 2022, the Company achieved its highest single month production rate to date averaging 35,830 boe/d. Subsequently, production volumes in the quarter were negatively impacted by planned third-party processing facility outages including a 24 day turnaround at the Veresen Midstream Hythe Plant, and an 11 day turnaround at the Keyera Wapiti Plant;
- The Company realized a record operating netback(1) of $41.97/boe, an increase of 114% over Q2 2021 and an 11% increase over Q1 2022. Excluding the realized loss on commodity risk management contracts of $10.51/boe, the Company’s field operating netback(1) for Q2 2022 was $52.48/boe;
- The Company also achieved record adjusted funds flow from operations(1) of $110.4 million ($0.58 per share basic and $0.39 per share fully diluted), more than tripling its adjusted funds flow from operations(1) of $35.5 million in Q2 2021, while representing a 28% or $24.1 million increase from Q1 2022 adjusted funds flow from operations(1) of $86.3 million;
- Total capital expenditures, including capitalized G&A, were $77.8 million during the three months ended June 30, 2022. The Company continued its 2022 capital program with 10 wells drilled and 9 wells completed in the quarter;
- In Q2 2022, the Company generated record free cash flow(1) of $32.6 million, representing 30% of its adjusted funds flow from operations(1) (as compared to the three months ended June 30, 2021 – free cash flow deficit of $12.1 million). In executing its return of capital to shareholders plan, the Company utilized $14.0 million or 43% of the free cash flow(1) to repurchase common shares during the quarter, with the remainder allocated to deleveraging its balance sheet. The Company anticipates that it will continue to produce free cash flow(1) throughout the remainder of 2022 which it will direct towards further deleveraging and share repurchases;
- As previously announced, the Company commenced its inaugural Normal Course Issuer Bid (“NCIB”) in Q4 2021. In the quarter ended June 30, 2022, Pipestone purchased 2,826,100 common shares for cancellation at a weighted average price of $4.95 per share for a total consideration of $14.0 million including related commissions and fees. Subsequent to the quarter, and up to the date of this release, the Company has purchased an additional 1,300,000 common shares for cancellation at a weighted average price of $3.80 per share. Since the commencement of the NCIB program, the Company has purchased a total of 6,559,800 common shares at a weighted average price of $4.50 per share. Pipestone intends to continue to utilize its NCIB throughout 2022 as part of its commitment to providing shareholder returns; and
- The Company realized robust returns on invested capital, with Q2 2022 annualized ROCE(1) and CROIC(1) of 44% and 41%, respectively, as compared to Q2 2021 annualized ROCE(1) and CROIC(1) of 14% and 19%, respectively.
(1) See “Advisory Regarding Non-GAAP Measures - Non-GAAP measures” advisory.
Pipestone Energy Corp. – Financial and Operating Highlights
|
Three months ended June 30,
|
Six months ended June 30,
|
| ($ thousands, except per unit and per share amounts) |
2022
|
|
2021 |
|
2022
|
|
2021 |
|
| Financial |
|
|
|
|
|
|
|
|
|
|
|
|
| Sales of liquids and natural gas |
$ |
210,380 |
|
$ |
82,319 |
|
$ |
363,910 |
|
$ |
153,804 |
|
| Cash from operating activities |
|
129,599 |
|
|
33,732 |
|
|
193,611 |
|
|
51,829 |
|
| Adjusted funds flow from operations(1) |
|
110,438 |
|
|
35,498 |
|
|
196,755 |
|
|
63,740 |
|
| Per share, basic |
|
0.58 |
|
|
0.19 |
|
|
1.03 |
|
|
0.33 |
|
| Per share, diluted(4) |
|
0.39 |
|
|
0.13 |
|
|
0.69 |
|
|
0.23 |
|
| Capital expenditures |
|
77,790 |
|
|
47,553 |
|
|
155,749 |
|
|
93,842 |
|
| Free cash flow (deficit)(1) |
|
32,648 |
|
|
(12,055 |
) |
|
41,006 |
|
|
(30,102 |
) |
| Income (loss) and comprehensive income (loss) |
|
82,095 |
|
|
(1,190 |
) |
|
109,147 |
|
|
(2,144 |
) |
| Per share, basic |
|
0.43 |
|
|
(0.01 |
) |
|
0.57 |
|
|
(0.01 |
) |
| Per share, diluted(4) |
|
0.29 |
|
|
(0.01 |
) |
|
0.39 |
|
|
(0.01 |
) |
| Adjusted EBITDA(1) |
|
115,044 |
|
|
39,722 |
|
|
206,083 |
|
|
72,229 |
|
| Annualized cash return on invested capital (CROIC)(1) |
|
41 |
% |
|
19 |
% |
|
37 |
% |
|
17 |
% |
| Annualized return on capital employed (ROCE)(1) |
|
44 |
% |
|
14 |
% |
|
39 |
% |
|
12 |
% |
| Net debt (end of period)(1) |
|
|
|
|
|
|
|
191,563 |
|
|
208,027 |
|
| Net debt to annualized adjusted fund flow from operations for the trailing period(1) |
|
0.4x |
|
|
1.5x |
|
|
0.5x |
|
|
1.6x |
|
| Available funding (end of period)(1) |
|
|
|
|
|
|
|
87,623 |
|
|
16,586 |
|
| Amount purchased under NCIB |
|
14,049 |
|
|
- |
|
|
21,230 |
|
|
- |
|
| Common shares purchased under NCIB (000s) |
|
2,826 |
|
|
- |
|
|
4,311 |
|
|
- |
|
| Common shares outstanding (000s) (end of period) |
|
|
|
|
|
|
|
188,437 |
|
|
191,548 |
|
| Weighted-average basic shares outstanding (000s) |
|
190,224 |
|
|
191,466 |
|
|
190,862 |
|
|
191,180 |
|
| Weighted-average diluted shares |
|
|
|
|
|
|
|
|
|
|
|
|
| outstanding (000s)(4) |
|
285,966 |
|
|
278,668 |
|
|
286,563 |
|
|
278,247 |
|
| Operations |
|
|
|
|
|
|
|
|
|
|
|
|
| Production |
|
|
|
|
|
|
|
|
|
|
|
|
| Condensate (bbls/d) |
|
8,428 |
|
|
7,345 |
|
|
8,197 |
|
|
7,175 |
|
| Other natural gas liquids (NGLs) (bbls/d) |
|
4,137 |
|
|
3,211 |
|
|
4,000 |
|
|
2,980 |
|
| Total NGLs (bbls/d) |
|
12,565 |
|
|
10,556 |
|
|
12,197 |
|
|
10,155 |
|
| Crude oil (bbls/d) |
|
79 |
|
|
83 |
|
|
56 |
|
|
87 |
|
| Natural gas (Mcf/d) |
|
108,754 |
|
|
76,180 |
|
|
101,590 |
|
|
73,369 |
|
| Total (boe/d)(2) |
|
30,770 |
|
|
23,336 |
|
|
29,185 |
|
|
22,470 |
|
| Condensate and crude oil (mix of total production) |
|
28 |
% |
|
32 |
% |
|
28 |
% |
|
33 |
% |
| Total liquids (mix of total production) |
|
41 |
% |
|
46 |
% |
|
42 |
% |
|
46 |
% |
| Average realized prices(3) |
|
|
|
|
|
|
|
|
|
|
|
|
| Condensate (per bbl) |
|
133.44 |
|
|
76.56 |
|
|
127.61 |
|
|
70.96 |
|
| Other NGLs (per bbl) |
|
61.18 |
|
|
26.32 |
|
|
58.44 |
|
|
26.54 |
|
| Total NGLs (per bbl) |
|
109.65 |
|
|
61.27 |
|
|
104.93 |
|
|
57.93 |
|
| Crude oil (per bbl) |
|
128.74 |
|
|
68.79 |
|
|
121.61 |
|
|
63.97 |
|
| Natural gas (per Mcf) |
|
8.50 |
|
|
3.31 |
|
|
7.13 |
|
|
3.49 |
|
| Netbacks |
|
|
|
|
|
|
|
|
|
|
|
|
| Revenue (per boe) |
|
75.13 |
|
|
38.76 |
|
|
68.89 |
|
|
37.82 |
|
| Realized loss on commodity risk |
|
|
|
|
|
|
|
|
|
|
|
|
| management contracts (per boe) |
|
(10.51 |
) |
|
(5.09 |
) |
|
(7.89 |
) |
|
(4.72 |
) |
| Royalties (per boe) |
|
(5.96 |
) |
|
(0.24 |
) |
|
(5.14 |
) |
|
(0.92 |
) |
| Operating expense (per boe) |
|
(12.88 |
) |
|
(11.11 |
) |
|
(12.01 |
) |
|
(10.89 |
) |
| Transportation expense (per boe) |
|
(3.81 |
) |
|
(2.72 |
) |
|
(3.89 |
) |
|
(2.67 |
) |
| Operating netback (per boe)(1) |
|
41.97 |
|
|
19.60 |
|
|
39.96 |
|
|
18.62 |
|
| Adjusted funds flow netback (per boe)(1) |
|
39.44 |
|
|
16.72 |
|
|
37.25 |
|
|
15.67 |
|
(1) See “Advisory Regarding Non-GAAP Measures - Non-GAAP measuresadvisory.
(2) For a description of the boe conversion ratio, see “Oil and Gas Measures - Basis of barrel of oil equivalent”. References to crude oil in production amounts are to the product type “tight oil” and references to natural gas in production amounts are to the product type “shale gas”. References to total liquids include oil and natural gas liquids (including condensate, butane and propane).
(3) Figures calculated before hedging.
(4) Weighted-average number of diluted shares outstanding for the purpose of calculating diluted income and comprehensive income and adjusted funds flow from operations per share in the 2022 period presented includes 92,439,513 common shares that are issuable at the discretion of convertible preferred shareholders as of June 30, 2022 for no additional proceeds to the Company (June 30, 2021 – 86,667,329 common shares issuable). The convertible preferred shares have a total convertible value of $78.6 million at June 30, 2022 (June 30, 2021 - $73.7 million) and are convertible on a conversion ratio equal to the quotient of (i) the liquidation preference of $1,000 per convertible preferred share, subject to adjustment, divided by (ii) the conversion price of $0.85 per share. The impact of other dilutive instruments is also factored into this calculation as applicable.
OPERATIONS UPDATE:
Development Map:
A chart accompanying this announcement is available at https://www.globenewswire.com/NewsRoom/AttachmentNg/06e1c83d-32f6-4e35-93f1-9bdc4781fa44
Drilling & Completions Update:
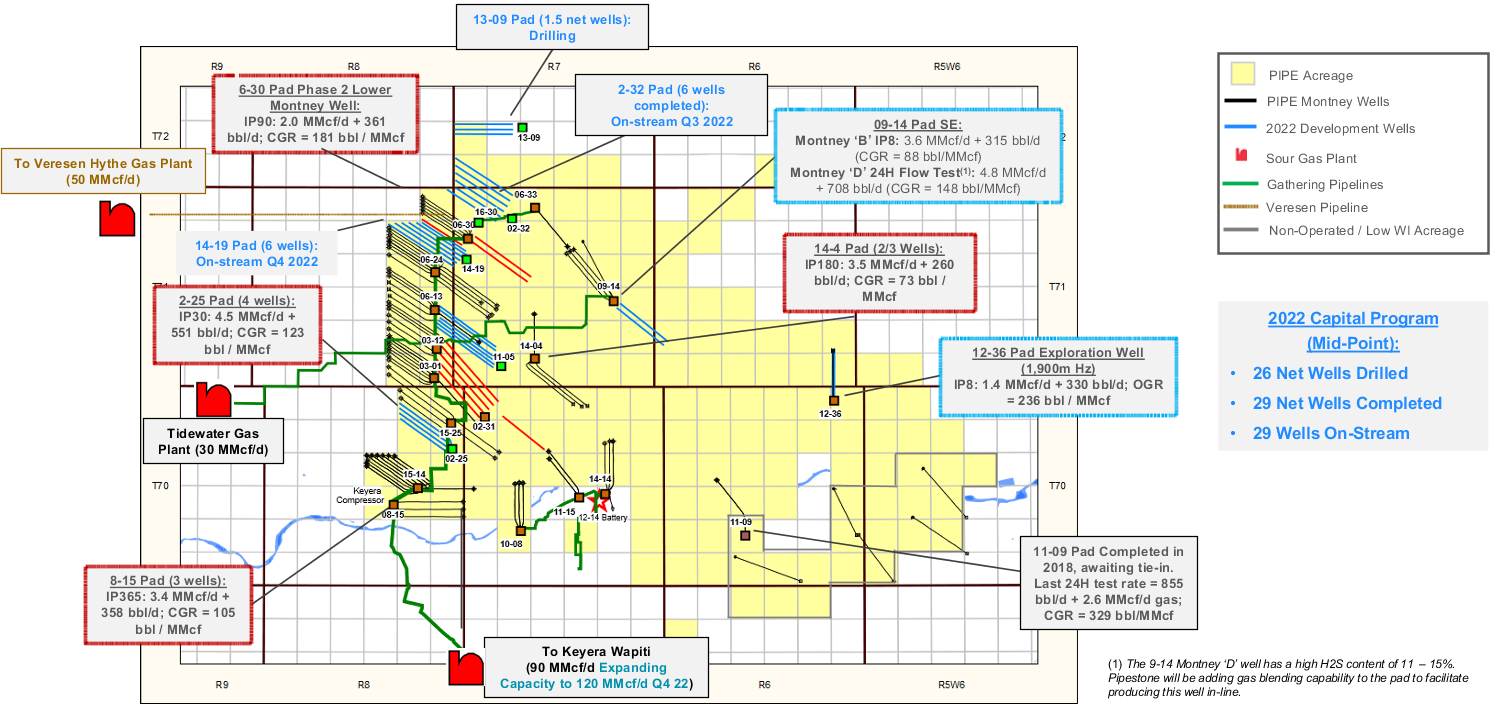
During the second quarter, Pipestone rig released six wells on the 2-32 pad, and four of a total six planned wells on the 14-19 pad. The Company plans to drill an additional 9.5 net wells during 2022.
The Company also completed its 12-36 eastern step-out well, two delineation wells southeast off the 9-14 pad, and the six wells located at its 2-32 pad. Pipestone plans to complete an additional 7.5 net wells during the remainder of 2022.
New Well Results:
During Q2 2022, Pipestone brought on stream four wells on the 2-25 padsite, which are piloting reduced inter-well spacing of 200m, as compared to the offset 15-25 pad spacing at 300m. Additionally, this pad includes the Company’s first well landed in the uppermost Montney ‘A’ zone. Over the first 30 days on production, these wells are producing at or above type curve expectations, with the wells averaging 4.5 MMcf/d raw gas + 551 bbl/d wellhead condensate (condensate gas ratio of ~123 bbl/MMcf). The Montney ‘A’ well is performing in-line with the Montney ‘B’ wells on both an absolute rate and condensate gas ratio basis.
During July 2022, production testing began on two delineation wells that were drilled southeast off the 9-14 pad, including a well landed in each of the Montney ‘B’ and Montney ‘D’ zones. The Company is encouraged by the preliminary test results. The Montney ‘B’ well has been flowing for ~8 days, at an average rate of 3.6 MMcf/d raw gas + 315 bbl/d wellhead condensate (condensate gas ratio of ~88 bbl/MMcf), with an average H2S reading of 3%. This result is in-line with our type curve expectations for this area and de-risks a significant portion of the asset that is currently unbooked. The Montney ‘D’ (Lower Montney) well flowed up casing for 24 hours, at an average rate of 4.8 MMcf/d raw gas + 708 bbl/d wellhead condensate (condensate gas ratio of ~148 bbl/MMcf) at a flowing pressure of ~10,000 kPa, with an H2S content range of 11 - 15%. Further testing and diagnostic work for the well is ongoing. Of note, Pipestone’s in-field gathering system is licensed for up to 8% H2S, as compared to a current field average H2S content of ~4.5%; the Company is currently producing wells with higher sour gas content by utilizing lower H2S Montney wells and sweet fuel gas to blend at various padsites, a strategy which will be replicated in the future on the 9-14 pad.
2022 Production Outlook:
During July 2022, which included 2 days of the planned turnaround at the Keyera Wapiti Gas Plant, corporate production averaged ~33,000 boe/d. During Q3 2022, the Company expects production to average 31,000 – 33,000 boe/d, which includes a 24-day planned turnaround at the Tidewater Gas Plant in September. The expansion of the 8-15 compressor (from 90 MMcf/d to 120 MMcf/d) is still expected to be in-service during Q4 2022, supporting forecast average fourth quarter volumes in excess of 37,000 boe/d. Pipestone is pleased to reconfirm its full year 2022 production guidance of 31,000 – 33,000 boe/d.
|
2022
Guidance |
2023
Forecast |
2024
Forecast |
| Price Forecast |
US$95 WTI | $5.00 AECO | $0.80 CAD |
US$90 WTI | $4.00 AECO | $0.80 CAD |
| Full Year Production (boe/d) |
31,000 – 33,000 |
40,000 – 42,000 |
46,000 – 48,000 |
| AT Cash Flow (C$ MM) |
$380 - $420 |
$510 |
$445 |
| Capex (C$ MM) |
$225 - $235 |
$250 |
$200 |
| Free Cash Flow (C$ MM) |
$155 - $185 |
$260 |
$245 |
| NCIB Purchases ($MM |
$50 - $60 |
$50 |
$50 |
(Net Debt) / Net Cash ($MM)
|
($95) – ($75)
net debt |
$125
net cash |
$320
net cash |
| LTM Debt / Cash Flow (x) |
0.2x |
n.a. |
n.a. |
Second Quarter 2022 Financial Results Conference Call
Second quarter results are expected to be released before market open on August 10, 2022. A conference call has been scheduled for August 10, 2022 at 9:00 a.m Mountain Time (11:00 a.m Eastern Time) for interested investors, analysts, brokers, and media representatives.
Conference Call Details:
Please use the following participant registration URL to register for the Q2 2022 Financial Results Conference Call: https://register.vevent.com/register/BI24d63769265843a3b052eaaec478af62
This link will provide each registrant with a toll-free dial in number and a unique PIN to connect to the call.
Pipestone Energy Corp.
Pipestone is an oil and gas exploration and production company focused on developing its large contiguous and condensate rich Montney asset base in the Pipestone area near Grande Prairie. Pipestone expects to grow its production to 32 Mboe/d (midpoint) in 2022 and to approximately 55 Mboe/d by exit 2025, while generating significant free cash flow and de-leveraging the business. Pipestone is committed to building long term value for our shareholders while maintaining the highest possible environmental and operating standards, as well as being an active and contributing member to the communities in which it operates. Pipestone has achieved certification of all its production from its Montney asset under the Equitable Origin EO100TM Standard for Responsible Energy Development. Pipestone shares trade under the symbol PIPE on the TSX. For more information, visit www.pipestonecorp.com.
Pipestone Energy Contacts:
Paul Wanklyn
President and Chief Executive Officer
(587) 392-8407
paul.wanklyn@pipestonecorp.com |
Craig Nieboer
Chief Financial Officer
(587) 392-8408
craig.nieboer@pipestonecorp.com |
Dan van Kessel
VP Corporate Development
(587) 392-8414
dan.vankessel@pipestonecorp.com |
|
Advisory Regarding Non-GAAP Measures
Non-GAAP measures
Pursuant to section 5(4) of NI 52-112, quantitative reconciliation of the non-GAAP measures for the current and comparative period to the most directly comparable financial measure cannot be incorporated by reference because this document is an earnings news release. As such, included is a quantitative reconciliation table for cash flow, free cash flow, operating netback, adjusted funds flow netback, net debt, available funding, CROIC and ROCE below. Additionally, pursuant to section 7(2)(d) of NI 52-112, a description of any significant difference between the non-GAAP financial measure that is forward-looking and the equivalent historical non-GAAP financial measure must be included in proximity to the first instance of the non-GAAP financial measure that is forward-looking information. As such, this information should be included in respect of forecast cashflow on page 4. Additionally, for this forward-looking non-GAAP measure, the following must be included: (i) the news release discloses an equivalent historical non-GAAP financial measure; and (ii) the forecast cashflow that is forward-looking information is presented with no more prominence in the document than that of the equivalent historical non-GAAP financial measure.
This news release includes references to financial measures commonly used in the oil and natural gas industry. The terms “adjusted funds flow from operations”, “cash flow”, “free cash flow, “operating netback”, “adjusted funds flow netback”, “net debt”, “available funding”, “adjusted EBITDA”, “CROIC”, and “ROCE” are not defined under International Financial Reporting Standards (“IFRS”), which have been incorporated into Canadian GAAP, as set out in Part 1 of the Chartered Professional Accountants Canada Handbook – Accounting, are not separately defined under GAAP, and may not be comparable with similar measures presented by other companies. The reconciliations of these non-GAAP measures to the nearest GAAP measure are discussed in the Non-GAAP measures section of Pipestone’s management’s discussion and analysis (“MD&A”) for the quarter ended June 30, 2022 dated August 10, 2022, a copy of which is available electronically on Pipestone’s SEDAR profile at www.sedar.com.
Management of the Company believes the presentation of non-GAAP measures provides useful information to investors and shareholders as the measures provide increased transparency and the opportunity to better analyze and compare performance against prior periods.
Adjusted funds flow from operations
Pipestone uses “adjusted funds flow from operations” (cash from operating activities before changes in non-cash working capital, cash share-based compensation and decommissioning provision costs incurred, if applicable), a measure that is not defined under IFRS. Adjusted funds flow from operations should not be considered an alternative to, or more meaningful than, cash from operating activities, income (loss) or other measures determined in accordance with IFRS as an indicator of the Company’s performance. Management of the Company uses adjusted funds flow from operations to analyze operating performance and leverage and believes it is a useful supplemental measure as it provides an indication of the funds generated by Pipestone’s principal business activities prior to consideration of changes in working capital, cash share-based compensation and decommissioning provision costs incurred.
The following table reconciles cash from operating activities to adjusted funds flow from operations:
|
Three months ended
June 30, |
|
Six months ended
June 30, |
| ($ thousands) |
2022 |
|
2021 |
|
2022 |
|
2021 |
|
$ |
|
$ |
|
$ |
|
$ |
| Cash from operating activities |
129,599 |
|
33,732 |
|
193,611 |
|
51,829 |
| Change in non-cash working capital |
(23,456 |
) |
1,766 |
|
(1,151 |
) |
11,911 |
| Cash share-based compensation |
4,295 |
|
- |
|
4,295 |
|
- |
| Adjusted funds flow from operations |
110,438 |
|
35,498 |
|
196,755 |
|
63,740 |
Operating netback and adjusted funds flow netback
Operating netback is calculated on either a total dollar or per-unit-of-production basis and is determined by deducting royalties, operating and transportation expense from liquids and natural gas sales adjusted for realized gains/losses on commodity risk management contracts.
The following table details the calculation of operating netback on a total dollar basis:
|
Three months ended
June 30, |
|
Six months ended
June 30, |
| ($ thousands) |
2022 |
|
2021 |
|
|
2022 |
|
2021 |
|
|
$ |
|
$ |
|
|
$ |
|
$ |
|
| Sales of liquids and natural gas |
210,380 |
|
82,319 |
|
|
363,910 |
|
153,804 |
|
| Realized loss on commodity risk management contracts |
(29,431 |
) |
(10,807 |
) |
|
(41,684 |
) |
(19,198 |
) |
| Royalties |
(16,698 |
) |
(507 |
) |
|
(27,147 |
) |
(3,726 |
) |
| Operating expense |
(36,053 |
) |
(23,601 |
) |
|
(63,418 |
) |
(44,279 |
) |
| Transportation expense |
(10,660 |
) |
(5,770 |
) |
|
(20,572 |
) |
(10,860 |
) |
| Operating netback |
117,538 |
|
41,634 |
|
|
211,089 |
|
75,741 |
|
The following table reconciles cash from operating activities to operating netback:
|
Three months ended
June 30, |
|
Six months ended
June 30, |
| ($ thousands) |
2022 |
|
2021 |
|
2022 |
|
2021 |
|
$ |
|
$ |
|
$ |
|
$ |
| Cash from operating activities |
129,599 |
|
33,732 |
|
193,611 |
|
51,829 |
| Change in non-cash working capital |
(23,456 |
) |
1,766 |
|
(1,151 |
) |
11,911 |
| G&A expense |
2,494 |
|
1,912 |
|
5,006 |
|
3,512 |
| Cash share-based compensation |
4,295 |
|
- |
|
4,295 |
|
- |
| Cash financing expense |
4,547 |
|
3,960 |
|
9,056 |
|
7,981 |
| Realized loss on interest rate risk management contracts |
59 |
|
264 |
|
272 |
|
508 |
| Operating netback |
117,538 |
|
41,634 |
|
211,089 |
|
75,741 |
| G&A expense |
2,494 |
|
1,912 |
|
5,006 |
|
3,512 |
| Cash financing expense |
4,547 |
|
3,960 |
|
9,056 |
|
7,981 |
| Realized loss on interest rate risk management contracts |
59 |
|
264 |
|
272 |
|
508 |
| Adjusted funds flow netback |
110,438 |
|
35,498 |
|
196,755 |
|
63,740 |
Adjusted funds flow netback reflects adjusted funds flow from operations on a per-unit-of-production basis and is determined by dividing adjusted funds flow from operations by total production on a per-boe basis. Adjusted funds flow netback can also be determined by deducting G&A, transaction costs, cash financing expense, adding financing income and adjusting for realized gains/losses on interest rate risk management contracts on a per-unit-of-production basis from the operating netback.
Operating netback and adjusted funds flow netback are common metrics used in the oil and natural gas industry and are used by the Company’s management to measure operating results on a per boe basis to better analyze and compare performance against prior periods, as well as formulate comparisons against peers. These measures should not be considered an alternative to or more meaningful than cash from operating activities defined under IFRS.
Adjusted working capital and available funding
Available funding is comprised of adjusted working capital and undrawn portions of the Company’s credit facility. The available funding measure allows management and others to evaluate the Company’s short-term liquidity. Adjusted working capital is a non-GAAP measure and is comprised of current assets less current liabilities on the Company’s consolidated statement of financial position and excludes the current portion of risk management contracts and lease liabilities. Adjusted working capital should not be considered an alternative to, or more meaningful than, working capital as defined under IFRS.
Cash flow
Cash flow is a non-GAAP measure that is calculated as cash from operating activities plus changes in non-cash working capital, cash share-based compensation and decommissioning provision costs incurred, and is not defined under IFRS. Cash flow should not be considered an alternative to, or more meaningful than, cash from operating activities, income (loss) or other measures determined in accordance with IFRS as an indicator of the Company’s performance. Management of the Company uses cash flow to analyze operating performance and leverage and believes it is a useful supplemental measure as it provides an indication of the funds generated by Pipestone’s principal business activities prior to consideration of changes in working capital, cash share-based compensation and decommissioning provision costs incurred.
The following table reconciles cash from operating activities to cash flow:
|
Three months ended
June 30, |
|
Six months ended
June 30, |
| ($ thousands) |
2022 |
|
2021 |
|
2022 |
|
2021 |
|
$ |
|
$ |
|
$ |
|
$ |
| Cash from operating activities |
129,599 |
|
33,732 |
|
193,611 |
|
51,829 |
| Change in non-cash working capital |
(23,456 |
) |
1,766 |
|
(1,151 |
) |
11,911 |
| Cash share-based compensation |
4,295 |
|
- |
|
4,295 |
|
- |
| Cash flow |
110,438 |
|
35,498 |
|
196,755 |
|
63,740 |
Free Cash Flow
Free cash flow should not be considered an alternative to, or more meaningful than, cash from operating activities as determined in accordance with IFRS as an indicator of financial performance. Free cash flow is presented to assist management and investors in analyzing operating performance by the business and how much cash flow is available for deleveraging and / or shareholder returns in the stated period after capital expenditures have been incurred. Free cash flow equals cash from operating activities plus the change in non-cash working capital and cash share-based compensation less capital expenditures.
The following table reconciles cash from operating activities to free cash flow:
|
Three months ended
June 30, |
|
Six months ended
June 30, |
| ($ thousands) |
2022 |
|
2021 |
|
|
2022 |
|
2021 |
|
|
$ |
|
$ |
|
|
$ |
|
$ |
|
| Cash from operating activities |
129,599 |
|
33,732 |
|
|
193,611 |
|
51,829 |
|
| Change in non-cash working capital |
(23,456 |
) |
1,766 |
|
|
(1,151 |
) |
11,911 |
|
| Cash share-based compensation |
4,295 |
|
- |
|
|
4,295 |
|
- |
|
| Capital expenditures |
(77,790 |
) |
(47,553 |
) |
|
(155,749 |
) |
(93,842 |
) |
| Free cash flow |
32,648 |
|
(12,055 |
) |
|
41,006 |
|
(30,102 |
) |
Net debt
Net debt is a non-GAAP measure that equals bank debt outstanding and adjusted working capital. The Company does not consider its convertible preferred share obligation to be part of net debt as this represents a non-cash obligation that will ultimately be settled by conversion into common shares and reclassified from a liability to share capital on the Company’s statement of financial position. Net debt is considered to be a useful measure in assisting management and investors to evaluate Pipestone’s financial strength.
Adjusted EBITDA, CROIC and ROCE
Adjusted EBITDA is calculated as profit or loss before interest, income taxes, depletion and depreciation, adjusted for other non-cash and extraordinary items including unrealized gains and losses on risk management contracts, realized losses on interest rate risk management contracts, share-based compensation and E&E expense. Adjusted EBITDA is considered a useful measure by management of the Company to understand and compare the profitability of Pipestone to other companies excluding the effects of capital structure, taxation and depreciation. Adjusted EBITDA is not defined under IFRS and therefore may not be comparable with the calculation of similar measures by other entities and should not be considered an alternative to, or more meaningful than, income (loss) and comprehensive income (loss). Adjusted EBITDA is also used to calculate CROIC. Adjusted EBIT is calculated as adjusted EBITDA less depletion and depreciation. Adjusted EBIT is used to calculate ROCE.
The following table reconciles income (loss) and comprehensive income (loss) to adjusted EBITDA:
|
Three months ended
June 30,
|
|
|
Six months ended
June 30,
|
|
| ($ thousands) |
2022 |
|
2021 |
|
|
2022 |
|
2021 |
|
|
$ |
|
$ |
|
|
$ |
|
$ |
|
| Income (loss) and comprehensive income (loss) |
82,095 |
|
(1,190 |
) |
|
109,147 |
|
(2,144 |
) |
| Deferred income tax expense |
25,085 |
|
841 |
|
|
32,663 |
|
727 |
|
| Financing expense |
6,150 |
|
5,609 |
|
|
12,240 |
|
11,271 |
|
| Unrealized gain on interest rate risk management contracts |
(591 |
) |
(419 |
) |
|
(1,477 |
) |
(764 |
) |
| Realized loss on interest rate risk management contracts |
59 |
|
264 |
|
|
272 |
|
508 |
|
| D&D expense |
19,807 |
|
15,899 |
|
|
37,750 |
|
30,605 |
|
| E&E expense |
829 |
|
414 |
|
|
829 |
|
414 |
|
| Share-based compensation |
4,641 |
|
1,011 |
|
|
6,077 |
|
1,585 |
|
| Unrealized (gain) loss on commodity risk management contracts |
(23,031 |
) |
17,293 |
|
|
8,582 |
|
30,027 |
|
| Adjusted EBITDA |
115,044 |
|
39,722 |
|
|
206,083 |
|
72,229 |
|
CROIC is determined by dividing adjusted EBITDA by the gross carrying value of the Company’s oil and gas assets at a point in time. For the purposes of the CROIC calculation, the net carrying value of the Company’s exploration and evaluation assets, property and equipment and ROU assets, is taken from the Company’s consolidated statement of financial position, and excludes accumulated depletion and depreciation as disclosed in the financial statement notes to determine the gross carrying value.
ROCE is determined by dividing adjusted EBIT by the carrying value of the Company’s net assets. For the purposes for the ROCE calculation, net assets are defined as total assets on the Company’s consolidated statement of financial position less current liabilities at a point in time.
CROIC and ROCE allow management and others to evaluate the Company’s capital spending efficiency and ability to generate profitable returns by measuring profit or loss relative to the capital employed in the business.
The Company has calculated its CROIC and ROCE using annualized results for the three and six months ended June 30, 2022 and balances as at June 30, 2022 and 2021 as follows:
|
Three months ended
June 30,
|
|
Six months ended
June 30,
|
| ($ thousands) |
2022 |
2021 |
|
2022 |
2021 |
|
$ |
$ |
|
$ |
$ |
| Adjusted EBITDA |
115,044 |
39,722 |
|
206,083 |
72,229 |
|
|
|
|
|
|
| Annualized Adjusted EBITDA(1) |
460,176 |
158,888 |
|
412,166 |
144,458 |
(1) Annualized factor 4x for the three months ended June 30, 2022 and 2021. Annualized factor 2x for the six months ended June 30, 2022 and 2021.
|
|
As at June 30,
|
|
| ($ thousands) |
|
2022 |
|
2021 |
|
|
|
$ |
|
$ |
|
| Exploration and evaluation (E&E) assets – gross carrying value |
|
29,033 |
|
33,868 |
|
| Property and equipment (P&E) – net carrying value |
|
843,000 |
|
654,436 |
|
| P&E – accumulated D&D |
|
155,687 |
|
91,282 |
|
| E&E assets and P&E – gross carrying value |
|
1,027,720 |
|
779,586 |
|
| ROU assets – net carrying value |
|
77,850 |
|
51,759 |
|
| ROU assets – accumulated depreciation |
|
19,809 |
|
11,055 |
|
| E&E, P&E and ROU assets – gross carrying value |
|
1,125,379
|
|
842,400
|
|
|
|
|
|
| Annualized CROIC (three months ended June 30) |
|
41 |
% |
19 |
% |
| Annualized CROIC (six months ended June 30) |
|
37 |
% |
17 |
% |
|
Three months ended
June 30,
|
|
|
Six months ended
June 30,
|
|
| ($ thousands) |
2022 |
|
2021 |
|
|
2022 |
|
2021 |
|
|
$ |
|
$ |
|
|
$ |
|
$ |
|
| Adjusted EBITDA |
115,044 |
|
39,722 |
|
|
206,083 |
|
72,229 |
|
| D&D expense |
(19,807 |
) |
(15,899 |
) |
|
(37,750 |
) |
(30,605 |
) |
| Adjusted EBIT |
95,237 |
|
23,823 |
|
|
168,333 |
|
41,624 |
|
|
|
|
|
|
|
| Annualized Adjusted EBIT(1) |
380,948 |
|
95,292 |
|
|
336,666 |
|
83,248 |
|
(1) Annualized factor 4x for the three months ended June 30, 2022 and 2021. Annualized factor 2x for the six months ended June 30, 2022 and 2021.
|
|
As at June 30, |
| ($ thousands) |
|
2022 |
|
2021 |
|
|
|
$ |
|
$ |
|
| Total assets |
|
1,014,395 |
|
777,549 |
|
| Total current liabilities |
|
(152,336 |
) |
(101,206 |
) |
| Net Assets |
|
862,059 |
|
676,343 |
|
|
|
|
|
| Annualized ROCE (three months ended June 30) |
|
44 |
% |
14 |
% |
| Annualized ROCE (six months ended June 30) |
|
39 |
% |
12 |
% |
Advisory Regarding Forward-Looking Statements
In the interest of providing shareholders of Pipestone and potential investors information regarding Pipestone, this news release contains certain information and statements (“forward-looking statements”) that constitute forward-looking information within the meaning of applicable Canadian securities laws. Forward-looking statements relate to future results or events, are based upon internal plans, intentions, expectations and beliefs, and are subject to risks and uncertainties that may cause actual results or events to differ materially from those indicated or suggested therein. All statements other than statements of current or historical fact constitute forward-looking statements. Forward-looking statements are typically, but not always, identified by words such as “anticipate”, “estimate”, “expect”, “intend”, “forecast”, “continue”, “propose”, “may”, “will”, “should”, “believe”, “plan”, “target”, “objective”, “project”, “potential” and similar or other expressions indicating or suggesting future results or events.
Forward-looking statements are not promises of future outcomes. There is no assurance that the results or events indicated or suggested by the forward-looking statements, or the plans, intentions, expectations or beliefs contained therein or upon which they are based, are correct or will in fact occur or be realized (or if they do, what benefits Pipestone may derive therefrom).
In particular, but without limiting the foregoing, this news release contains forward-looking statements pertaining to: Pipestone’s capital investment program, including drilling and other development plans for the remainder of 2022 and beyond, the Company’s intention to continue frac operations through the remainder of the year, as well as growth of production, cash flow and free cash flow; Pipestone’s intention to continue to purchase common shares under the NCIB throughout the remainder of 2022 and beyond and the Company’s commitment to providing shareholder returns; expectations regarding the Company’s 2022 business plan and its ability to deleverage; expected timing to reduce net debt; the Company’s intention to deploy capital expenditures on drilling, completion and pad-site equipping and tie-in activity; forecasted average production volumes for Q3 and Q4 2022; expectations regarding 2022 annual production volumes and beyond; the Company’s expectations and timing for recovering take-or-pay fees incurred over the remainder of 2022; Pipestone’s intention to continue its licenses with 2022 expiry dates; 2023 and 2024 forecasts for each of production, cash flow, capital expenditures/development plans, free cash flow, net debt/net cash and cash flow; the Company’s expectations with respect to capital management and liquidity; continued testing and diagnostic work for the Montney 'D' (Lower Montney) well; the timing of the 8-15 compressor expansion; the timing and duration of the 24-day planned turnaround at the Tidewater Gas Plant; and the Company’s long-term strategy.
With respect to the forward-looking statements contained in this news release, Pipestone has assessed material factors and made assumptions regarding, among other things: future commodity prices and currency exchange rates, including consistency of future oil, NGLs and natural gas prices with current commodity price forecasts; the economic impacts of the COVID-19 pandemic; Pipestone’s continued ability to obtain qualified staff and equipment in a timely and cost-efficient manner; the predictability of future results based on past and current experience; the predictability and consistency of the legislative and regulatory regime governing royalties, taxes, environmental matters and oil and gas operations, both provincially and federally; Pipestone’s ability to successfully market its production of oil, NGLs and natural gas; the timing and success of drilling and completion activities (and the extent to which the results thereof meet expectations); Pipestone’s future production levels and amount of future capital investment, and their consistency with Pipestone’s current development plans and budget; future capital expenditure requirements and the sufficiency thereof to achieve Pipestone’s objectives; the successful application of drilling and completion technology and processes; the applicability of new technologies for recovery and production of Pipestone’s reserves and other resources, and their ability to improve capital and operational efficiencies in the future; the recoverability of Pipestone 's reserves and other resources; Pipestone’s ability to economically produce oil and gas from its properties and the timing and cost to do so; the performance of both new and existing wells; future cash flows from production; future sources of funding for Pipestone’s capital program, and its ability to obtain external financing when required and on acceptable terms; future debt levels; geological and engineering estimates in respect of Pipestone’s reserves and other resources; the accuracy of geological and geophysical data and the interpretation thereof; the geography of the areas in which Pipestone conducts exploration and development activities; the timely receipt of required regulatory approvals; the access, economic, regulatory and physical limitations to which Pipestone may be subject from time to time; and the impact of industry competition.
The forward-looking statements contained herein reflect management of the Company's current views, but the assessments and assumptions upon which they are based may prove to be incorrect. Although Pipestone believes that its underlying assessments and assumptions are reasonable based on currently available information, undue reliance should not be placed on forward-looking statements, which are inherently uncertain, depend upon the accuracy of such assessments and assumptions, and are subject to known and unknown risks, uncertainties and other factors, both general and specific, many of which are beyond Pipestone’s control, that may cause actual results or events to differ materially from those indicated or suggested in the forward-looking statements. Such risks and uncertainties include, but are not limited to, volatility in market prices and demand for oil, NGLs and natural gas and hedging activities related thereto; the ability to successfully manage the Company's operations; general economic, business and industry conditions; variance of Pipestone’s actual capital costs, operating costs and economic returns from those anticipated; the ability to find, develop or acquire additional reserves and the availability of the capital or financing necessary to do so on satisfactory terms; the availability of sufficient natural gas processing capacity; and risks related to the exploration, development and production of oil and natural gas reserves. Additional risks, uncertainties and other factors are discussed in the MD&A dated August 10, 2022 and in Pipestone’s annual information form dated March 9, 2022, copies of which are available electronically on Pipestone’s SEDAR profile at www.sedar.com.
Certain information in this news release is a “financial outlook” within the meaning of applicable Canadian securities laws. The purpose of the financial outlook is to provide readers with disclosure of the Company’s reasonable expectations of anticipated results. The financial outlook is provided as of the date of this news release. Certain assumptions made underlying the financial outlook are disclosed herein under “Operations Outlook – 2022 Production Outlook”. Readers are cautioned that the financial outlook may not be appropriate for other purposes.
The forward-looking statements contained in this news release are made as of the date hereof and Pipestone assumes no obligation to update or revise any forward-looking statements, whether as a result of new information, future events or otherwise, unless required by applicable securities laws. All forward-looking statements herein are expressly qualified by this advisory.
Oil and Gas Measures
Basis of barrel of oil equivalent
Petroleum and natural gas reserves and production volumes are stated as a “barrel of oil equivalent” (boe), derived by converting natural gas to oil equivalency in the ratio of 6,000 cubic feet of gas to one barrel of oil. Readers are cautioned that boe figures may be misleading, particularly if used in isolation. A boe conversion ratio of 6,000 cubic feet of gas to one barrel of oil is based on energy equivalency, which is primarily applicable at the burner tip, and does not represent a value equivalency at the wellhead.
Initial Production Rates and Short-Term Test Rates
This news release may disclose test rates of production for certain wells over short periods of time (i.e. IP30, IP60, IP90, etc.), which are preliminary and not determinative of the rates at which those or any other wells will commence production and thereafter decline. Short-term test rates are not necessarily indicative of long-term well or reservoir performance or of ultimate recovery. Although such rates are useful in confirming the presence of hydrocarbons, they are preliminary in nature, are subject to a high degree of predictive uncertainty as a result of limited data availability and may not be representative of stabilized on-stream production rates.
Production over a longer period will also experience natural decline rates, which can be high in the Montney play and may not be consistent over the longer term with the decline experienced over an initial production period. Initial production or test rates may also include recovered “load” fluids used in well completion stimulation operations. Actual results will differ from those realized during an initial production period or short-term test period, and the difference may be material.
Production
References to natural gas and condensate production in this news release refer to the shale gas and natural gas liquids (which includes condensate), respectively, product types as defined in National Instrument 51-101 – Standards of Disclosure for Oil and Gas Activities. References to liquids include tight oil and NGLs (including condensate, butane and propane).
Abbreviations
The following summarizes the abbreviations used in this document:
| Crude Oil, Condensate and other Natural Gas Liquids and Natural Gas |
| bbl |
barrel |
Mcf |
thousand cubic feet |
| bbls/d |
barrels per day |
MMcf |
million cubic feet |
| boe |
barrel of oil equivalent |
Mcf/d |
thousand cubic feet per day |
| boe/d |
barrel of oil equivalent per day |
GJ |
Gigajoule; 1 Mcf of natural gas is about 1.05 GJ |
| Mboe/d |
thousand barrels of oil equivalent per day |
MMcf/d |
million cubic feet per day |
| NGL |
natural gas liquids, consisting of ethane (C2), propane (C3) and butane (C4) |
|
|
| condensate |
Pentanes plus (C5+) separated at the field level and C5+ separated from the NGL mix at the facility level |
|
|
| Other Abbreviations |
|
|
| adjusted working capital |
working capital (current assets less current liabilities), excluding financial derivative instruments and lease liabilities |
| AECO |
the AECO Hub, a natural gas storage facility located in Suffield and Countess, Alberta, part of the NOVA Pipeline System |
| C$ |
Canadian dollars |
| COVID-19 |
Novel Coronavirus and its variants |
| CROIC |
cash return on invested capital |
| D&D |
depletion and depreciation |
| E&E |
exploration and evaluation |
| EBIT |
earnings before interest and taxes |
| EBITDA |
earnings before interest, taxes, depreciation and amortization |
| G&A |
general and administrative |
| GAAP |
generally accepted accounting principles |
| H2S |
hydrogen sulfide |
| IFRS |
International Financial Reporting Standards |
| Keyera |
Keyera Corp. and its affiliates |
| kPa |
kilopascal |
| NCIB |
normal course issuer bid |
| Q1 |
first quarter ended March 31st |
| Q2 |
second quarter ended June 30th |
| Q3 |
third quarter ended September 30th |
| Q4 |
fourth quarter ended December 31st |
| ROCE |
return on capital employed |
| ROU |
right-of-use |
| sour gas |
natural gas containing H2S in quantities greater than 100 ppm |
| TSX |
Toronto Stock Exchange |
| US$ |
United States dollars |
| WTI |
West Texas Intermediate |