The recent rally showed quite a bit of promise.
Gold stocks surged past their long-term moving averages while breadth indicators surpassed all prior bear market peaks (excluding 2016). 71% of the HUI and 81% of GDXJ closed above the 200-day moving average.
GDX and GDXJ looked to be on their way to $25 and $37, with Gold approaching $1360/oz and those breadth figures on the way to hitting 90%.
However, the stock market rebound pushed past its initial resistance and precious metals reversed course yet again before hitting those targets.
Other than 1985-1987 there has never been a bull market in precious metals without their simultaneous outperformance of the stock market.
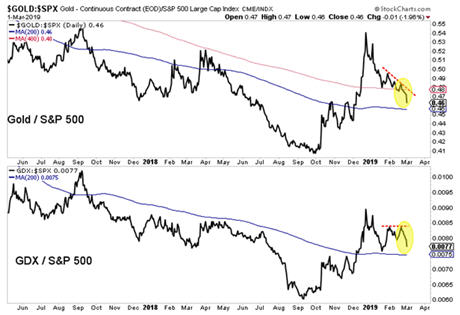
Gold stocks and Gold especially have trended lower against the stock market since the end of December. The price action suggests this relative weakness should continue over the days and weeks ahead. If the ratios in the chart below lose the 200-day moving average then the next strong support becomes the 2018 autumn lows.

It was also disappointing that Gold peaked prior to touching $1360/oz. This leaves a noticeable lower high on the chart.
Meanwhile, Silver did not confirm Gold’s rise in February. It formed a double top as twice it failed at a confluence of resistance at $16.00/oz.

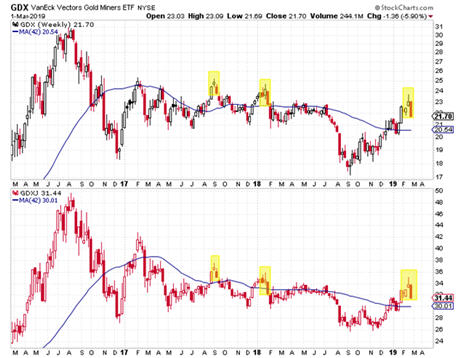
Turning to the gold stocks, we find the price action of the past two weeks is similar to the peaks in summer 2017 and January 2018.

February 2019 figures to mark at least an interim peak in precious metals. The next key support for Gold and the gold stocks are the 200-day moving averages.
If the gold stocks can maintain recent breadth gains then the 200-day moving averages could mark an important low within a fledgling uptrend. If not, then a retest of the 2018 lows (especially in the gold stocks and Silver) becomes a stronger possibility.
As we noted last week, the near-term outlook for the stock market is bullish and in the current context that is negative for precious metals which cannot breakout or begin a bull market until the Fed turns from a pause to rate cuts.
Plenty of values remain in the mining equities and we should see more come about as spring beckons.
To learn which juniors have 3x and 5x potential over the next 12-18 months, consider learning more about our premium service.