Since last spring we’ve written over and over again about a Fed rate cut being the catalyst for a bull move in gold stocks.
The history is almost bulletproof. Many lows in gold stocks over the past 60 years coincided with the end of rate hikes.
At present the Federal Reserve is in pause mode and the market is on the cusp of pricing in a rate cut. Friday, Fed funds futures showed a 56% chance of a rate cut by January 2020.
However, precious metals have yet to make new 52-week highs. The gold stocks (GDX & GDXJ) are much closer to doing so than the metals.
Simply waiting for the Fed to cut rates risks missing out on some upside. As market timers, we have to anticipate it.
Is there a leading indicator for the Fed moving from a pause to a cut?
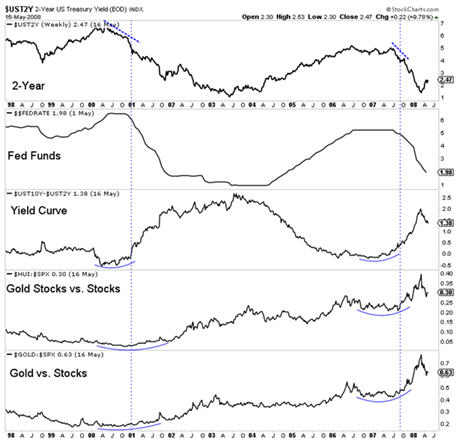
Take a look at the chart below in which we plot data from the last two instances of new rate cut cycles: 2001 and 2007. The vertical lines highlight the Fed’s first cut in those two cycles.

There are several observations to make.
First, Gold and gold stock relative performance accelerated after the rate hikes.
Second, the 10-year and 2-year yield spread began to steepen prior to that outperformance and prior to the rate cuts. And that’s because the 2-year yield, which is a proxy for the Fed funds rate, was trending lower in advance of the first cut.
In short, the sharp decline in the 2-year yield preceded the Fed moving from a pause to a cut. Prior to both the 2001 and 2007 cuts, the 2-year yield had declined by over 1%.
How does this compare to today?
The yield curve has yet to steepen and precious metals have not begun or confirmed outperformance against the stock market.
However, the positive sign for precious metals is the 2-year yield has already declined from nearly 3% down to 2.24% as we pen this.

Every cycle is different and each has its own nuances but we cannot ignore the current decline in the 2-year yield. The closer it gets to 2.00%, the more the market will price in a rate cut.
With its decline to 2.24% today (Monday) the market has now priced in a 73% chance of a rate cut by January 2020. Not surprisingly, precious metals are trading higher.
If the 2-year yield continues to decline then precious metals (and gold stocks especially) should build more and more evidence that they are in a new bull market.
To learn what stocks we are buying and think have 3x to 5x potential, consider learning more about our premium service.