HOW CONCERNING IS THE RECENT SPIKE IN OIL PRICES?
Monday’s news was filled with blurbs similar to the one below from CNBC:
“Stocks fell on Monday amid fears that a surge in oil prices following an attack in Saudi Arabia could slow down global economic growth.”
Thus, it may be helpful to know how stocks have performed after big one-day spikes in the price of oil. Charlie Bilello’s Twitter feed (@CharlieBilello) contains dates of the largest one-day spikes in the price of oil (1983-2019).
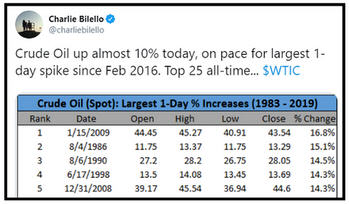
HOW DID STOCKS PERFORM WALKING FORWARD?
Instead of marking the end of civilization as we know it, in most cases, the stock market posted satisfying returns after one-day spikes in the price of oil. In fact, 100% of the cases below featured significantly higher stock prices two years from the date of the “concerning” spike in oil prices. The median gain two years later was 32.82% and the worst case saw stocks rise by 12.92%. The present-day case will follow a unique path, but history tells us not to be overly concerned about Monday’s pop in oil.

TESTING THE LONGER-TERM BULLISH HYPOTHESIS
The stock market provided a clear “be open to better than expected outcomes” signal in
January 2019 after market participants created a rare breadth thrust. Did last week’s shifts related to value vs. growth and interest rates negate the longer-term bullish breadth thrust thesis? You can decide after watching this week’s video.
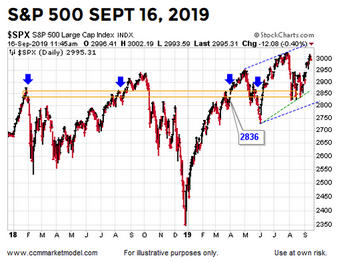
REALISTIC EXPECTATIONS
While life would be easier if it were not the case, in the real world the stock market is a volatile and difficult-to-tame animal. Having realistic expectations about a wide range of scenarios, including those on the bearish side of the ledger, can help us avoid emotional surprises. Based on numerous timeframes, a push back toward 2880-ish on the S&P 500 would not be shocking, even under a longer-term bullish scenario.
As always, we will continue to take it day by day and see how the data unfolds in the coming days, weeks, and months.
Important Disclosures: While the CCM Market Model is based on sound economic and investment principles, there is no guarantee any of the objectives will be met in the future. The terms odds and probabilities also speak to uncertain outcomes. Risks are covered in more detail in the CCM Client Agreement and LPOA. The performance information presented in certain charts or tables represent backtested performance from December 31, 2002 to December 31, 2017, using the model to select ETFs and adjust portfolio allocations based on market conditions. Backtested performance is hypothetical (it does not reflect trading in actual accounts) and is provided for informational purposes only to indicate historical performance had the model portfolios been available over the relevant period. Front-end screens were added to the model in May 2017, and subsequently backtested in the second half of 2017. Backtested performance does not represent actual performance and should not be interpreted as an indication of such performance. Backtested performance results have inherent limitations, some of which are described herein. Backtested returns do not represent the performance results of actual trading and are calculated through the retroactive application of the advisor's model portfolio configuration, designed with the benefit of hindsight. Since backtested performance results do not represent actual trading, they may not reflect the impact that material economic and market factors might have had on the decision-making of the advisor, if the advisor was managing the client assets. No representation is being made that the advisor's strategy will or is likely to achieve profits or losses like those shown. In fact, there are frequently significant material differences between backtested performance results and performance results subsequently achieved by following a strategy. In addition, backtested performance does not involve financial risk, and no hypothetical trading record can completely account for the impact of financial risk in actual trading. For example, the ability to withstand losses or adhere to a trading program in spite of trading losses are material points which can also adversely affect actual trading results. There are numerous other factors related to the markets in general or to the implementation of any specific trading program which cannot be fully accounted for in the preparation of backtested performance results and all of which can adversely affect actual trading results. The backtested performance results shown reflect the deduction of: (i) an average annual asset management fee of 0.87%; and (ii) estimated transaction fees and other expenses that a client would experience. The results portrayed reflect the reinvestment of dividends, interest and other income, as appropriate. Backtested performance results assume weekly rebalancing at the end of each week. It is important to understand the assumption of weekly rebalancing has an impact on the annual and weekly returns shown. For weekly rebalancing, the weekly return is calculated with the assumption that the portfolio is perfectly in balance at the beginning of each week. In actual portfolios, however, rebalancing occurs at no set time, and such actions are dependent on both market conditions and individual client liquidity inflows and outflows, along with the cost impact of such transactions on the overall portfolio. As with any investment strategy, there is potential for profit as well as the possibility of loss. CCM does not guarantee any minimum level of investment performance or the success of any client account, model portfolio, or investment strategy. All investments involve risk and investment recommendations will not always be profitable. Past performance does not guarantee future results. Backtested results do not guarantee future results. Results are compared to the performance of the S&P 500 Index ETF (SPY) for informational purposes only. The advisor's investment program does not mirror the S&P 500 Index and the volatility of the advisor's investment program may be materially different. The securities or other instruments included in the S&P 500 Index are not necessarily included in the advisor's portfolio and criteria for inclusion in the S&P 500 Index are different than those for investment by the advisor. The performance of the S&P 500 Index ETF was obtained from published sources believed to be reliable, but which are not warranted as to accuracy or completeness. All references to the S&P 500 Index ETF SPY are to the total return form of the ETF, meaning the impact of dividends is included. Unless noted otherwise, the returns of indices presented herein do not reflect fees or transaction costs, nor net dividends, if any. A description of each index follows: The S&P 500 Index, a diversified index that includes the stocks of 500 U.S. listed, large capitalization companies in major industries. Past performance, including hypothetical past performance, is not indicative of future performance. There can be no assurance that the advisor will achieve its objectives. Any performance information, market analysis or data or other information is not warranted by Ciovacco Capital Management, LLC (CCM or Ciovacco Capital) as to completeness or accuracy express or implied, and such information is subject to change without notice. CCM's investment strategies may change from time to time based on market conditions and enhancements to its investment methods and strategy without further notice. This website and the information contained herein are for informational purposes only and do not constitute a complete description of our investment services, funds or strategies. The data in this website have been prepared by CCM and have not been reviewed, compiled or audited by an independent public accountant. The views expressed on this website represent the current, good faith views of the authors at the time of publication. Please be aware that these views are subject to change at any time and without notice of any kind. CCM assumes no duty and does not undertake to update these views or any forward-looking statements, which are subject to numerous assumptions, risks, and uncertainties, which change over time. All material presented herein is believed to be reliable, but we cannot attest to its accuracy. The information contained herein (including historical prices or values) has been obtained from sources that Ciovacco Capital Management (CCM) considers to be reliable; however, CCM makes no representation as to, or accepts any responsibility or liability for, the accuracy or completeness of the information contained herein, or any decision or action taken by you or any third party in reliance upon the data. Some results are derived using historical estimations from available data. Readers are urged to check with tax advisors before making any investment decisions. This memorandum is not an offer to buy or sell or a solicitation of an offer to buy or sell the securities mentioned. The investments discussed or recommended in this report may be unsuitable for investors depending on their specific investment objectives and financial position. The price or value of the investments to which this report relates, either directly or indirectly, may fall or rise against the interest of investors. All prices and yields contained in this report are subject to change without notice. This information is based on hypothetical assumptions and is intended for illustrative purposes only. PAST PERFORMANCE DOES NOT GUARANTEE FUTURE RESULTS. Investments: Not FDIC Insured - No Bank Guarantee - May Lose Value. Investing in securities involves risks, and there is always the potential of losing money when you invest in securities. Before investing, consider your investment objectives and CCM's fees and other expenses. CCM's services are designed to assist clients in achieving discrete financial goals. They are not intended to provide comprehensive tax advice or financial planning with respect to every aspect of a client's financial situation and do not incorporate specific investments that clients hold elsewhere. For more details, see our
Form ADV Part 2 and other disclosures. Not an offer, solicitation of an offer, or advice to buy or sell securities in jurisdictions where CCM is not registered.