THIS IS WHAT A MAJOR TREND REVERSAL LOOKS LIKE
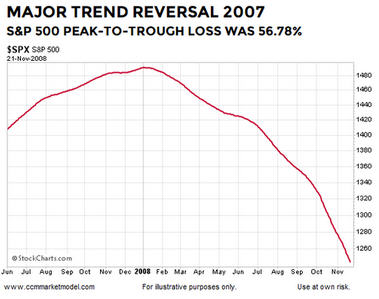
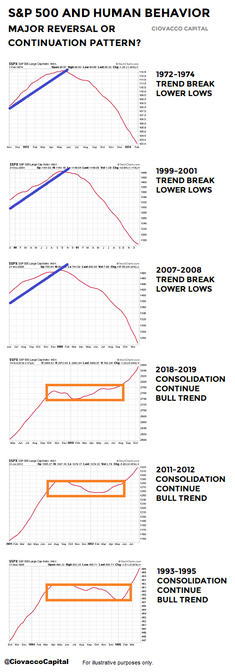
The three periods shown below produced an average peak-to-trough loss of over 50%. Thus, it is prudent to understand some of the common characteristics found in all three cases. We can then look for similar characteristics in the present day. Imagine if you were a few years away from retirement when the 1973-1974 bear market hit. The S&P 500 dropped 48.2% causing many sleepless nights.
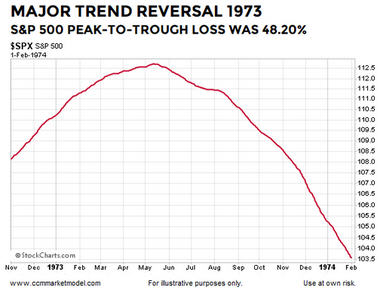
The chart above shows the S&P 500’s 200-day moving average during the earlier stages of the 1973-1974 bear market that came to an end on October 3, 1974. The chart seems fairly simple, but contains a ton of valuable information about a major shift in investor expectations regarding future economic and market outcomes.
While the combination of fundamental factors, including valuations, interest rates, inflation, economic issues, and geopolitical events are significantly different in all three major bear markets, there are also important and consistent lessons for investors. On the left side of the 1999-2001 chart below, the net aggregate opinion of all market participants regarding all subjects on all timeframes was bullish. Consequently, the bias was for the market to move higher based on positive expectations about future economic and market outcomes. In the early stages of the bear market, more and more market participants begin to respect the problems of the day, resulting in a major and sustained shift in the net aggregate opinion of all market participants regarding all subjects on all timeframes. Consequently, the odds shift to favoring a series of lower lows rather than a series of higher highs.

These examples provide a fact-based response to a common objection to historical studies:
“But today is significantly different from the periods shown in numerous ways.”
“Today is different” is always true. No two periods in human history have the exact same combination of fundamental, geopolitical, economic, psychological, and technical factors. The three painful bearish periods shown here (1973-1974, 2000-2002, and 2007-2009) are all unique in significant ways, but the process of a major shift in the net aggregate opinion of all market participants looks very similar in all three cases. Stated more simply, the whys differ in each case, but the major trend reversals are very similar.
The early stages of the financial crisis bear market occurred in a significantly different fundamental environment relative to the oil embargo 1970s and dot-com-hyped early 2000s, but the process of a major shift in market sentiment is similar in many important ways. There is nothing magical about the 200-day moving average; this is an exercise in pattern recognition. Chart patterns reflect patterns of human thought. People think and behave in similar ways near a major market peak because human greed and fear are constants. The same is true for all patterns in the stock market (bullish, neutral, and bearish).
HOW DOES THE SAME CHART LOOK TODAY?
If we look at the question above, it can be rephrased in this manner:
“Are we seeing a similar bearish shift in the net aggregate opinion of all market participants regarding all relevant subjects on all timeframes?”
The answer is no. The present day chart also represents a discernible pattern in human behavior. From a traditional charting perspective, the 2019 chart below appears to be a continuation pattern. The trend on the left side of the chart below is bullish. We are all familiar with the expression the market needs to consolidate its gains, which is exactly what took place in the center of the chart below. Given what we know today, we have a bullish trend, a period of consolidation, and what appears to be a resumption of the bullish trend.
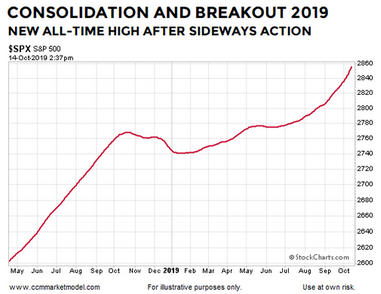
Does the chart above look anything like the 1973-1974, 1999-2001, or 2007-2008 major-bear-market-reversal charts above? The answer is no, which means, as of this writing, the net aggregate opinion favors higher highs in the coming months relative to lower lows. The previous sentence contains a probabilistic statement based on the facts we have in hand today. If the facts change in a material manner, we must reassess the probabilities.
PATTERNS REFLECT COMMON HUMAN BEHAVIOR
The 200-day is useful here because we have a discernible pattern, just as there were discernible patterns in the three major bear market cases. In a continuation-pattern scenario, the net aggregate opinion over time is adversely impacted by a set of concerning issues (think Fed policy errors and the trade war in 2018). These issues cause the net aggregate opinion to shift in a similar manner to what transpired near the major S&P 500 peaks in 1973, 2000, and 2007. The difference in the continuation-pattern case is the concerning issues are addressed in some manner (Fed shifted in early January 2019 and trade has been trending in the right direction).
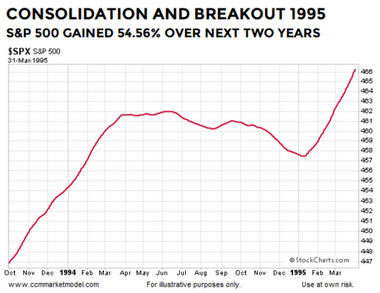
Thus, in the continuation-pattern cases, the net aggregate opinion shifts back to a bullish bias allowing the prior bullish trend to continue, which is exactly what happened in the 1994-1995 case shown below. The combination of factors is unique in each case, but the net outcome is the same. After consolidating and breaking out, the S&P 500 resumed its bullish trend and gained 54.56% over the next two years from the date shown on the chart below.
A similar shift in fundamental perceptions and human expectations occurred in the 2011-2012 continuation-pattern case. Once again, the combination of fundamental issues were different in the 1994-1995 and 2011-2012 cases, but the net interpretation and subsequent behavior by market participants was very similar. The results were similar as well; from the date shown in the chart below, the S&P 500 gained 39.97% over the next two years.

INSTITUTIONS AND FUNDAMENTALS
It would bolster the bullish thesis above if (a) present day fundamentals supported ongoing expansion over an imminent recession, and (b) if institutions were still open to bullish economic and market outcomes. This week’s CCM stock market video looks at fundamentals and technicals which support the “avoid a recession” case and the “institutions have not given up on this market” case. After viewing the facts presented in the video, you can draw your own conclusions.
EXECUTIVE SUMMARY
Keeping in mind chart patterns enable us to monitor shifts in the net aggregate opinion of all market participants regarding all subjects on all timeframes, does the pattern in 2019 look more like the major-topping patterns or more like the continuation patterns?
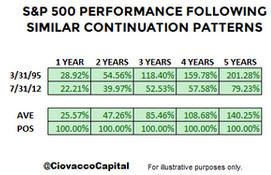
Since there is no question 2019 looks more like 1993-1995 and 2011-2012, it might be helpful to know what happened next in the two continuation-pattern cases. As the table shows below, the S&P 500 did continue the bullish trend and posted very impressive gains over the next five years.
ANALYSIS SPEAKS TO ODDS
Logic can be used to minimize the odds of repeating
common investing missteps. The weight of the evidence says we should remain open to better than expected stock market outcomes while respecting the odds are based on the information we have in hand today. When the next major bear market arrives, the concepts outlined above will still be helpful; the message will simply shift from “sit tight with growth-oriented investments” to “take action to reduce risk to our hard-earned principal”. We will continue to take it day by day, while remaining open to all outcomes from wildly bullish to wildly bearish.
This week’s
stock market video will most likely expand on the concepts covered above. Recent studies involving the
market action near the 200-day and
Fibonacci retracements align with the continuation-pattern thesis above.
WHAT ABOUT SMALL SAMPLE SIZES?
We cannot control sample sizes. There have only been three 40%-plus declines in the S&P 500 since 1950 (1973-74, 2000-2002, and 2007-2009), which represents a very small sample size. Are we supposed to totally ignore these major declines because of the small sample size? According to Reuters, the S&P 500 was officially launched on March 4, 1957, meaning any S&P 500 study deals with a very limited historical data set. It is what it is.

When we study rare events, we acknowledge the sample size and try to learn anything that can add value in the present day. There are countless economic and market studies that are based on small sample sizes. Typically, the small sample size argument is only raised when the results run counter to someone’s personal opinion. When results agree with someone’s personal view, the small sample size is suddenly not a problem. If you believe a study or data set is irrelevant, there is an easy solution - ignore it.
Important Disclosures: While the CCM Market Model is based on sound economic and investment principles, there is no guarantee any of the objectives will be met in the future. The terms odds and probabilities also speak to uncertain outcomes. Risks are covered in more detail in the CCM Client Agreement and LPOA. The performance information presented in certain charts or tables represent backtested performance from December 31, 2002 to December 31, 2017, using the model to select ETFs and adjust portfolio allocations based on market conditions. Backtested performance is hypothetical (it does not reflect trading in actual accounts) and is provided for informational purposes only to indicate historical performance had the model portfolios been available over the relevant period. Front-end screens were added to the model in May 2017, and subsequently backtested in the second half of 2017. Backtested performance does not represent actual performance and should not be interpreted as an indication of such performance. Backtested performance results have inherent limitations, some of which are described herein. Backtested returns do not represent the performance results of actual trading and are calculated through the retroactive application of the advisor's model portfolio configuration, designed with the benefit of hindsight. Since backtested performance results do not represent actual trading, they may not reflect the impact that material economic and market factors might have had on the decision-making of the advisor, if the advisor was managing the client assets. No representation is being made that the advisor's strategy will or is likely to achieve profits or losses like those shown. In fact, there are frequently significant material differences between backtested performance results and performance results subsequently achieved by following a strategy. In addition, backtested performance does not involve financial risk, and no hypothetical trading record can completely account for the impact of financial risk in actual trading. For example, the ability to withstand losses or adhere to a trading program in spite of trading losses are material points which can also adversely affect actual trading results. There are numerous other factors related to the markets in general or to the implementation of any specific trading program which cannot be fully accounted for in the preparation of backtested performance results and all of which can adversely affect actual trading results. The backtested performance results shown reflect the deduction of: (i) an average annual asset management fee of 0.87%; and (ii) estimated transaction fees and other expenses that a client would experience. The results portrayed reflect the reinvestment of dividends, interest and other income, as appropriate. Backtested performance results assume weekly rebalancing at the end of each week. It is important to understand the assumption of weekly rebalancing has an impact on the annual and weekly returns shown. For weekly rebalancing, the weekly return is calculated with the assumption that the portfolio is perfectly in balance at the beginning of each week. In actual portfolios, however, rebalancing occurs at no set time, and such actions are dependent on both market conditions and individual client liquidity inflows and outflows, along with the cost impact of such transactions on the overall portfolio. As with any investment strategy, there is potential for profit as well as the possibility of loss. CCM does not guarantee any minimum level of investment performance or the success of any client account, model portfolio, or investment strategy. All investments involve risk and investment recommendations will not always be profitable. Past performance does not guarantee future results. Backtested results do not guarantee future results. Results are compared to the performance of the S&P 500 Index ETF (SPY) for informational purposes only. The advisor's investment program does not mirror the S&P 500 Index and the volatility of the advisor's investment program may be materially different. The securities or other instruments included in the S&P 500 Index are not necessarily included in the advisor's portfolio and criteria for inclusion in the S&P 500 Index are different than those for investment by the advisor. The performance of the S&P 500 Index ETF was obtained from published sources believed to be reliable, but which are not warranted as to accuracy or completeness. All references to the S&P 500 Index ETF SPY are to the total return form of the ETF, meaning the impact of dividends is included. Unless noted otherwise, the returns of indices presented herein do not reflect fees or transaction costs, nor net dividends, if any. A description of each index follows: The S&P 500 Index, a diversified index that includes the stocks of 500 U.S. listed, large capitalization companies in major industries. Past performance, including hypothetical past performance, is not indicative of future performance. There can be no assurance that the advisor will achieve its objectives. Any performance information, market analysis or data or other information is not warranted by Ciovacco Capital Management, LLC (CCM or Ciovacco Capital) as to completeness or accuracy express or implied, and such information is subject to change without notice. CCM's investment strategies may change from time to time based on market conditions and enhancements to its investment methods and strategy without further notice. This website and the information contained herein are for informational purposes only and do not constitute a complete description of our investment services, funds or strategies. The data in this website have been prepared by CCM and have not been reviewed, compiled or audited by an independent public accountant. The views expressed on this website represent the current, good faith views of the authors at the time of publication. Please be aware that these views are subject to change at any time and without notice of any kind. CCM assumes no duty and does not undertake to update these views or any forward-looking statements, which are subject to numerous assumptions, risks, and uncertainties, which change over time. All material presented herein is believed to be reliable, but we cannot attest to its accuracy. The information contained herein (including historical prices or values) has been obtained from sources that Ciovacco Capital Management (CCM) considers to be reliable; however, CCM makes no representation as to, or accepts any responsibility or liability for, the accuracy or completeness of the information contained herein, or any decision or action taken by you or any third party in reliance upon the data. Some results are derived using historical estimations from available data. Readers are urged to check with tax advisors before making any investment decisions. This memorandum is not an offer to buy or sell or a solicitation of an offer to buy or sell the securities mentioned. The investments discussed or recommended in this report may be unsuitable for investors depending on their specific investment objectives and financial position. The price or value of the investments to which this report relates, either directly or indirectly, may fall or rise against the interest of investors. All prices and yields contained in this report are subject to change without notice. This information is based on hypothetical assumptions and is intended for illustrative purposes only. PAST PERFORMANCE DOES NOT GUARANTEE FUTURE RESULTS. Investments: Not FDIC Insured - No Bank Guarantee - May Lose Value. Investing in securities involves risks, and there is always the potential of losing money when you invest in securities. Before investing, consider your investment objectives and CCM's fees and other expenses. CCM's services are designed to assist clients in achieving discrete financial goals. They are not intended to provide comprehensive tax advice or financial planning with respect to every aspect of a client's financial situation and do not incorporate specific investments that clients hold elsewhere. For more details, see our Form ADV Part 2 and other disclosures. Not an offer, solicitation of an offer, or advice to buy or sell securities in jurisdictions where CCM is not registered.