In yesterday’s analysis, we wrote that the outlook for the precious metals sector remained bearish, and we wrote that
if you’ve been wondering which parts of the precious metals sector are likely to decline the most, we would still choose silver and mining stocks.
Indeed, silver and miners plunged more than gold, especially the latter.
Yesterday in the PMs
Just several days after many
gold traders,
gold investors, and
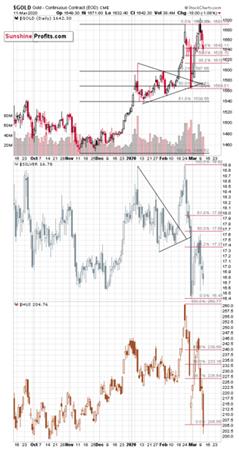
goldbugs thought that the sharp decline was nothing more than a bad dream, the reality really kicked in. Sharp decline was followed by a sharp correction, especially in the mining stocks, but that was not the end of the story. Gold miners failed to break above the 61.8% Fibonacci retracement level, and they continued their slide. Anyone holding short positions in silver and miners benefited greatly (we entered our short positions in them and in gold on
Feb 21st, a day before the top), and anyone insisting that silver and miners are going higher, is rather unhappy, to say the least.
The above chart also confirms the usefulness of the triangle-vertex-based reversals. Please note that both: gold and silver reversed right at the vertexes of their respective triangles. That happened, even though these triangles were not aligned. Gold’s vertex was several days later, so it’s not that surprising that gold made an intraday attempt to break above the previous high exactly then (the top in terms of the closing prices formed in February, though).
What’s next? Miners are leading the way lower in an extremely clear manner. Miners underperformance is known to be a bearish sign for the entire precious metals market and right now, we saw this signal taken to the extreme. The implications are very bearish.
The miners moved to new yearly lows in terms of both the intraday and closing prices. Before the corrective upswing on Friday, miners reversed visibly before the end of the session, which was a bullish sign for the very short term. We haven’t seen anything like that yesterday.
Without this reversal, the slide could continue.
Taking a cue from the
stock market, miners and silver have been declining strongly. And the stock market (
S&P 500) just broke below the June and March 2019 lows. The next really strong support is provided by the 2018 lows.
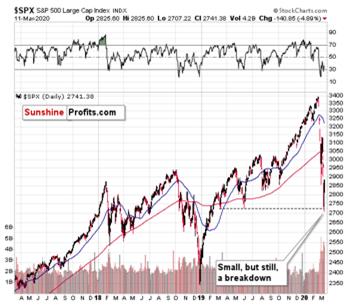
This means that as stocks slide, silver and especially miners, are likely to decline particularly strongly.
Looking at today’s first chart, it may seem that
gold stocks reached the bottom of their trading range and that the worst is over. But that’s only a small part of the truth. In order to get more details, we need to… At least see more on the chart. Let’s zoom out, and look at the mining stocks from a different perspective – using a different mining stock proxy. There’s been much written on the topic of which proxy to use:
HUI vs. GDX but in our view, it doesn’t hurt (and it’s a good
gold trading tip in general) to look at both before making a decision.
On a side note, it is a major mistake to apply regular technical tools to leveraged ETNs like NUGT or DUST, because their prices move not only on emotions, but also based on mechanisms specific to these vehicles (time decay, fees, etc.)
Focus on the Miners
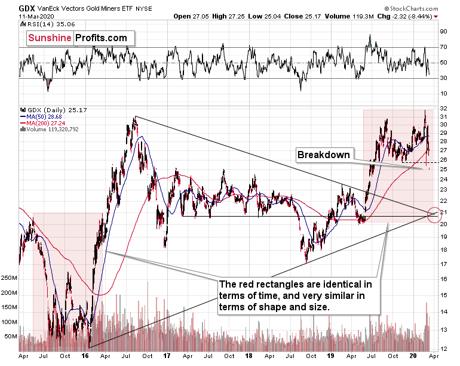
The medium-term GDX
ETF chart reveals a major development. The miners just broke below their late-2019 lows. This was not the yearly low, so why would that be important? Because there’s no really strong support all the way down until GDX reaches the $20 - $21 area.
Yes, it means doubling the recent GDX decline. And yes, it can and is likely to happen.
There's one more analogy that we would like to share with you. Please take a look at the price action in the two red rectangles. They are identical in terms of time and the current one is a bit smaller in terms of relative price movement.
They are very similar in terms of shape and - most likely - in terms of when they happened.
In 2015 and very early 2016, we saw the final part of the medium-term decline and the initial part of the short-term rebound. The decline was sharp at first, then miners consolidated, then they corrected, then they declined once again moving very temporarily to new lows and after invalidating this breakdown, they shot up with vengeance. And the reversal took place at the beginning of the year.
In 2019 and early 2020, we saw a mirror image of the above.
We saw the final part of the medium-term upswing and the initial part of the short-term decline. The rally was sharp at first, then miners consolidated, then they corrected, then they rallied once again moving very temporarily to new highs, and after they invalidated this breakout, they plunged with vengeance. And the reversal took place at the beginning of the year.
This similarity provides us with a few extra hints that other techniques don't.
It suggests that miners are unlikely to correct before they move even lower - likely to the price extreme that started the upswing (mid-2019 lows). At that price, we can expect a visible rebound, but it might not be anything to call home about - similar to the consolidation that we saw in March 2016. It might, however, be something similar to the very sharp and sizable correction that we saw so far this month, so it will be critical to monitor the market for indications.
The mid-2019 lows are a very good target also based on other reasons:
- Several 2017 and 2018 highs formed there (approximately)
- That's where (approximately) the declining support line based on the previous highs is located
- That's where (approximately) the rising support line based on the previous lows is located
Moreover, the two above-mentioned support lines cross toward the end of March, meaning that this is when the reversal could take place. Earlier today, we emphasized how well this technique worked in case of
predicting gold and in case of
predicting silver prices. While no technique can be 100% effective, it seems we have a good chance of seeing a temporary reversal close to the end of the month.
The outlook for the precious metals sector is definitely bearish.
Thank you for reading today’s free analysis. We would like to remind you that in addition to our Gold & Silver Trading Alerts (daily, plus intraday follow-ups when required), we just launched a new service - weekly
Gold Investment Updates, which are based on the flagship Gold & Silver Trading Alerts (size of a small e-book) that are priced quite conveniently. Plus, there’s promotion on them – the first 2 weeks are for just $1.
Try our Gold Investment Updates on preferred terms today.
Thank you.
Sincerely,
Przemyslaw Radomski, CFA
Editor-in-chief, Gold & Silver Fund Manager
Sunshine Profits - Effective Investments through Diligence and Care
* * * * *
All essays, research and information found above represent analyses and opinions of Przemyslaw Radomski, CFA and Sunshine Profits' associates only. As such, it may prove wrong and be subject to change without notice. Opinions and analyses were based on data available to authors of respective essays at the time of writing. Although the information provided above is based on careful research and sources that are believed to be accurate, Przemyslaw Radomski, CFA and his associates do not guarantee the accuracy or thoroughness of the data or information reported. The opinions published above are neither an offer nor a recommendation to purchase or sell any securities. Mr. Radomski is not a Registered Securities Advisor. By reading Przemyslaw Radomski's, CFA reports you fully agree that he will not be held responsible or liable for any decisions you make regarding any information provided in these reports. Investing, trading and speculation in any financial markets may involve high risk of loss. Przemyslaw Radomski, CFA, Sunshine Profits' employees and affiliates as well as members of their families may have a short or long position in any securities, including those mentioned in any of the reports or essays, and may make additional purchases and/or sales of those securities without notice.