Dan Norcini On The HUI/Gold Ratio I think this is a good post, in that it shows how oversold the miners are and yet points out that there could be significantly more downside.
I think that the odds favor a near term bottom forming in the current price area, but I may be wrong regarding that.
goldguy
https://traderdannorcini.blogspot.com/2014/10/hui-gold-ratio-hits-lowest-level-ever.html
Dan Norcini
I have been detailing this ratio chart quick often of late as I am of the opinion that the gold shares still lead the price of the metal. My concern for the outright price of gold has been noted as this plunging ratio has been a very good indicator for the future direction of the gold price thus far.
Much is made by the same culprits as usual about big sell orders on the Comex, takedown of this, takedown of that, the usual, blah, blah and more blah, as an attempt to buttress the notion that this fall in the price of gold has been orchestrated by the powers that be to discredit the metal.
The problem with this theory in this environment is that the MINING SHARES have been LEADING the metal lower. Gold is merely following what the miners have been very effectively signaling now for some time since this ratio began declining.
I cannot tell you how disconcerting it is to read the same discredited individuals ( who will not do us all a favor and simply go away) pedaling yet another "special insider claim" that they are privy to the origin of the sellers that "have hit gold with big sell orders eating through all the bids". What else is to be expected when large speculators are entering a market on the sell side or bailing out from off the long side, as their positions grow increasingly underwater? Tiny offers? Small lot sell orders? That is not the nature of today's computer-driven markets and anyone who trades for a living knows this quite well.
Those who continually attempt to make some sort of big deal about big sell orders as IF they are coming from the powers that be are nothing but pompous windbags spouting hot air that deludes only the unsuspecting and naïve.
Also, are we to assume that some nefarious evil agent has been working over the share of each and every mining company PRIOR to then going in and "taking down the gold price"? If the mining shares lead the way down in gold, then to be consistent with the latest gold perma-bull spin, someone would, by necessity, have had to first orchestrate a takedown of the mining companies that comprise all of the gold stock indices, not to mention have been selling all of that gold that has been withdrawn from GLD.
Here is the simple truth - the Dollar has been surging against its competitors; Central Banks have signaled their intention to either keep interest rates low or to provide stimulus or both; and commodity prices in general are falling. In that environment, one in which inflation is not a concern, stocks remain the GO TO asset class. Until that changes, gold is not going to attract sufficient capital flows from serious money managers and hedge funds to keep it levitated. Since the path of least resistance in the metal is therefore lower, that is exactly where it is going. There is no mystery whatsoever to any of this nor is there any conspiracy to force the price lower. Specs simply are not interested in an asset that pays no yield and which requires an overall economic environment in which its price is more likely to head higher.
Along this line, take a look at the HUI/Gold ratio chart once again. the only reason I note it once more is because something historic occurred with it today; it hit the lowest recorded level in the history of the HUI.
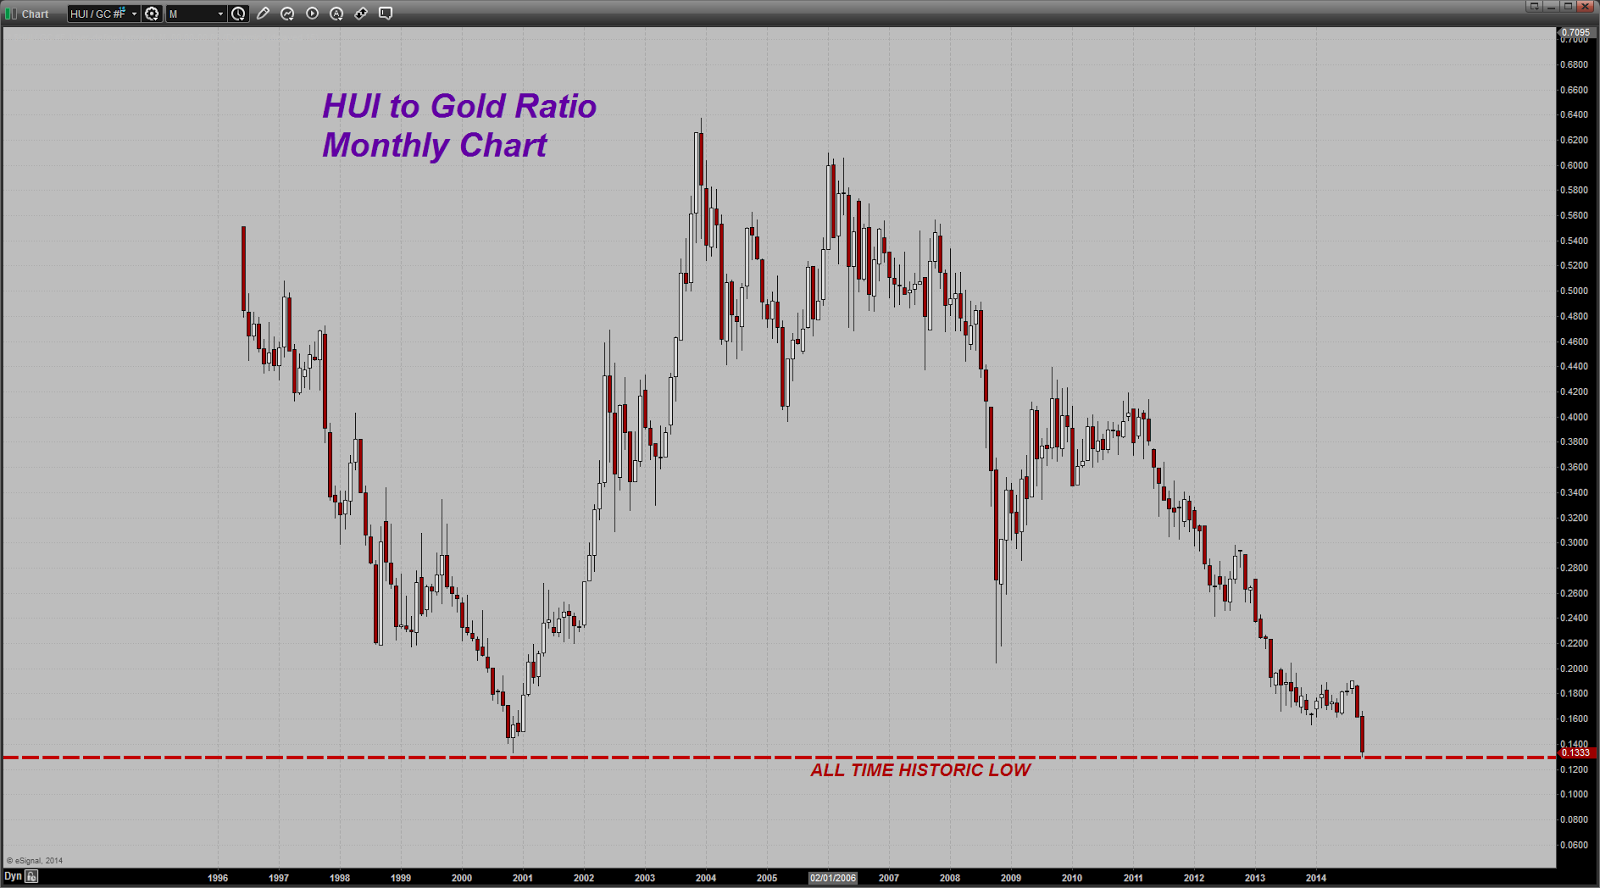
Again, this is HISTORIC. As such it signals either more losses lie ahead for gold or an abrupt turnaround for the mining shares. Since both the HUI and especially the GDXJ closed near their weekly lows, that does not look too likely at the moment.
In closing, let me say this... gold's downside breach of $1180 has as much technical significance as its breach of major chart support near the $1530-$1525 level in April of 2013. That too was a TRIPLE BOTTOM that failed.
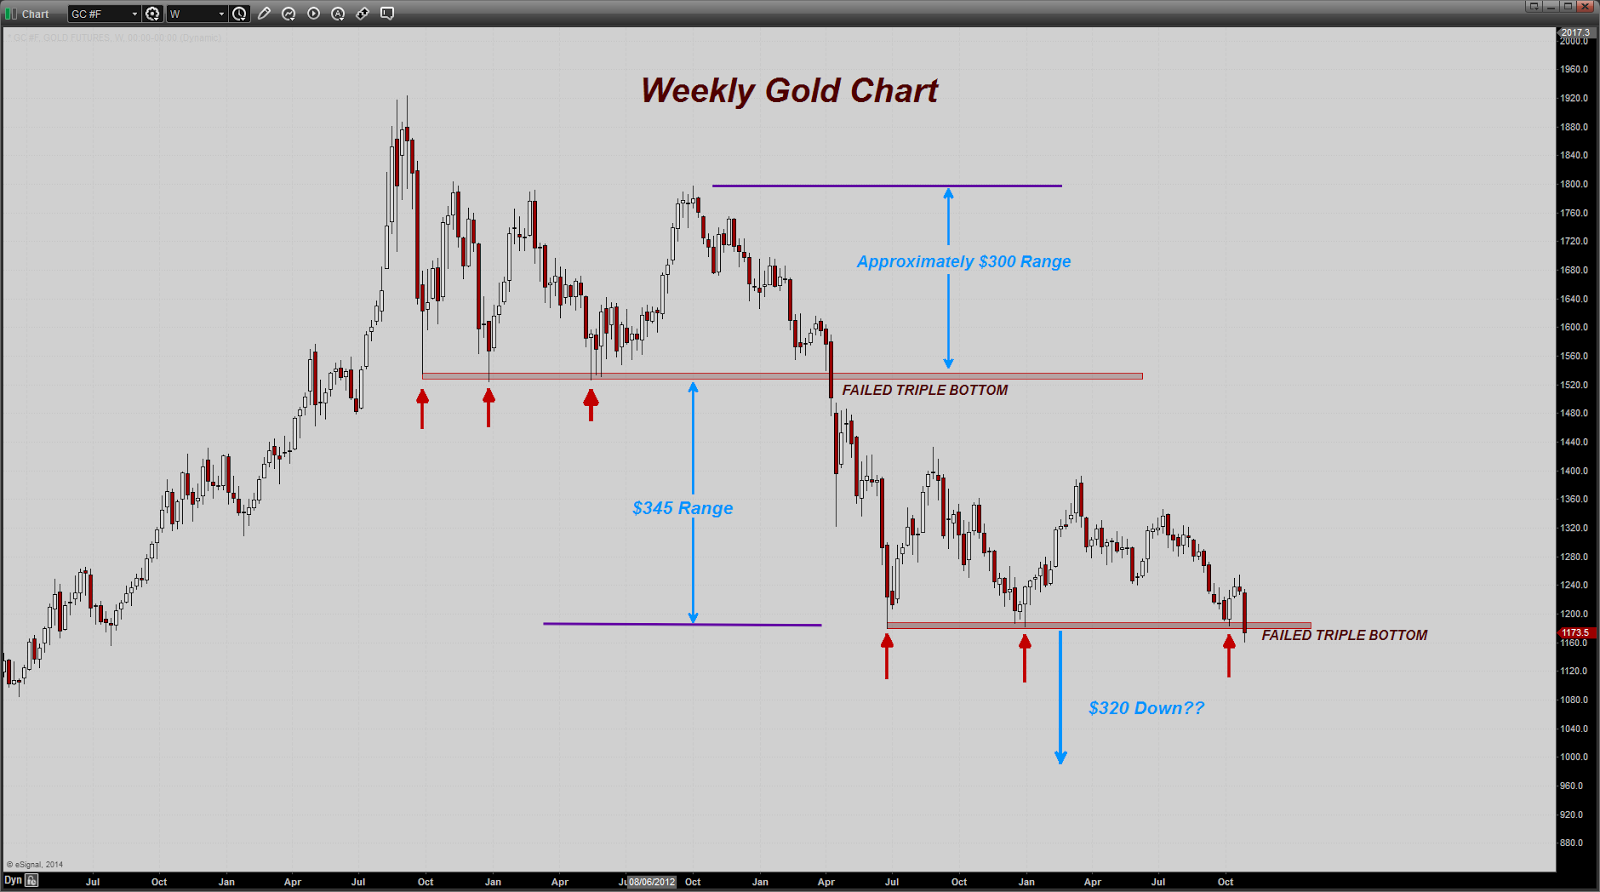
Note that gold spent 18-19 months moving sideways in a broad range between roughly $1800 on the top and $1530-$1525 on the bottom. When it broke down below that range at the TRIPLE BOTTOM it proceeded to fall another $345 before bottoming out and forming the base of a new 16-17 month long sideways trade above what proved to be another TRIPLE BOTTOM at $1180 that failed today.
The question now becomes will gold do what the pattern calls for, namely eventually leg down somewhere between $300 and $345 before bottoming and carving out yet another base? That could put the metal down as far as $835 - $880 before reaching a new bottom once more.
Of course that seems inconceivable to many but back when gold was trading in the range between $1800 and $1525, it seemed inconceivable at that time that it could ever fall as low as below the $1200 level!
Please note that this is not a prediction; it is merely an observation based upon an analysis of former price action which extrapolates POTENTIAL. Much of course depends on the overall direction of the US economy and whether or not Central Bank activity proves to be insufficient to deal with the deflationary headwinds buffeting it.
One thing that inclines me to not rule out a move this low is that HUI to Gold ratio charted and commented upon above. That is so far off the mean that some sort of reversion seems as if it is necessary to correct it and bring it back more within the norm. As stated before, it can do so either by the mining shares gaining on the price of gold or the price of gold falling faster than the overall price of the shares.
One last look at the LONG TERM CHART shows some Fibonacci retracement levels sketched in to provide some shorter term targets if the selling intensifies.

The downside is now open first to near the $1150 level. Failure there targets that $1100-$1090 level.....
Posted by Trader Dan at 7:43 PM