Introduction
Investors analyzing gold miners are faced with all sorts of cost metrics and miners often vary on how and what they report. In this article, I review my Total Costs which is a simple and effective approach for determining how much of the gold really gets to the shareholders. I explain how to calculate it and then provide a few examples.
Total Costs
Total Costs is a cost metric that I use in my own methodology to analyze the real costs for miners. Total Costs picks up everything. What is left after Total Costs is available for shareholders for either:
- dividends
- share repurchases
- acquisitions
- securing the balance sheet by funding working capital (i.e., increasing current assets versus current liabilities) and/or paying down debt
Thus, the lower the Total Costs, the more cash will be left to reward shareholders.
I think investors screening gold miners will find the simplicity of this approach attractive. It cuts through all the noise and shows you how much of the gold a company is really putting into the pockets of shareholders (so to speak).
How To Calculate
Here is the formula for calculating Total Costs:
(Revenue - Net Cash From Operating Activities + Capital Expenditures) / Total Gold Equivalent Ounces Produced
and here are the definitions:
Revenue = total revenues (for all metals) found at the top of the Income Statement
Net Cash From Operating Activities = the actual amount of cash produced by the business operations found at the bottom of the first section in the Cash Flow Statement
Capital Expenditures = in practice this is usually the "Additions to Property, Plant and Equipment" line item on the Cash Flow Statement. It captures all the long-term capital investment made during the year. (If you use the financial statements available through Seeking Alpha the line item actually reads, "Capital Expenditure.")
Total Gold Equivalent Ounces Produced = the value of all of a company's metal production measured in gold ounces (this is sometimes reported by miners). When it is not reported take the total amount of production for each separate metal and multiply each by the realized price for that metal (e.g., $2.95 per lb. copper). Then take this and divide by the realized gold price for the period and add that to the reported amount of gold production.
Note that Net Cash From Operating Activities - Capital Expenditures is free cash flow. I do not subtract out payments for acquisitions nor do I add in the proceeds from asset sales in order to provide the clearest picture of how much free cash the underlying business is actually generating. Besides, I consider acquisitions to be a use of free cash flow.
Essentially, what I am doing with Total Costs is subtracting free cash flow from total revenue to pick up every single cash cost.
Examples
Now, let us take a look at a few examples using the past 5 years to get more of a complete picture of total mining costs.
First up, Agnico Eagle (AEM):
| financials in $ millions | 2014 | 2015 | 2016 | 2017 | 2018 |
| Revenue | $1,900 | $1,990 | $2,140 | $2,240 | $2,190 |
| Less: Net Cash From Operations | $668 | $616 | $779 | $768 | $606 |
| Add: Capital Expenditures | $475 | $450 | $528 | $874 | $1,250 |
| Total Costs | $1,707 | $1,824 | $1,889 | $2,346 | $2,834 |
| Gold Equivalent Ounces Produced | 1,473,625 | 1,699,001 | 1,687,803 | 1,751,016 | 1,666,231 |
| Total Costs per Gold-Equivalent Ounce | $1,158 | $1,074 | $1,119 | $1,340 | $1,701 |
You can see here that Agnico Eagle's Total Costs are really around the $1,100 per ounce level. They were higher over the last 2 years because of increased capital expenditures. I don't know the company details, but on the surface, this tells me that the company is investing more to grow production. This is a good example of why it is important to look at costs over a multi-year period.
Next up, Newmont Goldcorp. (NEM) (only for heritage Newmont Mining):
| financials in $ millions | 2014 | 2015 | 2016 | 2017 | 2018 |
| Revenue | $6,819 | $6,085 | $6,680 | $7,379 | $7,253 |
| Less: Net Cash From Operations | $1,438 | $2,145 | $2,786 | $2,124 | $1,827 |
| Add: Capital Expenditures | $1,040 | $1,311 | $1,133 | $866 | $1,032 |
| Total Costs | $6,421 | $5,251 | $5,027 | $6,121 | $6,458 |
| Gold Equivalent Ounces Produced* | 5,405,992 | 5,997,007 | 5,448,833 | 5,908,813 | 5,716,032 |
| Total Costs per Gold-Equivalent Ounce | $1,188 | $876 | $926 | $1,036 | $1,130 |
*only includes gold and copper
Newmont's Total Costs averaged $1,031 per ounce over the last 5 years.
Finally, Barrick Gold (GOLD):
| financials in $ millions | 2014 | 2015 | 2016 | 2017 | 2018 |
| Revenue | $10,239 | $9,029 | $8,558 | $8,374 | $7,243 |
| Less: Net Cash From Operations | $2,296 | $2,794 | $2,640 | $2,065 | $1,765 |
| Add: Capital Expenditures | $2,432 | $1,713 | $1,126 | $1,396 | $1,400 |
| Total Costs | $10,375 | $7,948 | $7,044 | $7,705 | $6,878 |
| Gold Equivalent Ounces Produced* | 7,293,332 | 7,163,733 | 6,278,498 | 6,291,482 | 5,397,592 |
| Total Costs per Gold-Equivalent Ounce | $1,423 | $1,109 | $1,122 | $1,225 | $1,274 |
*only includes gold and copper
Barrick's Total Costs averaged $1,231 per ounce over the last 5 years.
Margin Calculation
Once you have an average Total Costs figure you can subtract it from your gold price assumption (e.g., $1,300 per oz.) to get your (shareholder) margin. For example, $1,300 per oz. less Newmont's average Total Costs of $1,031 per oz. is $269 per oz. and a 20.7% margin.
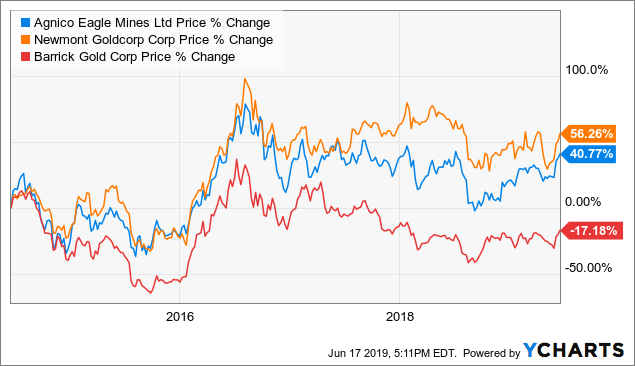
Strategic Conclusion
I find that Total Costs are not only (obviously) relevant to the bottom line but directly influence the share price of miners. Take a look at the following 5-year chart that compares the share price performance of Agnico Eagle, Newmont, and Barrick Gold:
 Data by YCharts
Newmont had the lowest Total Costs and the best share price performance whereas Barrick had the highest Total Costs and the worst share price performance.
It is beyond the scope of this analysis, but if you take a look at dividends you will typically see those miners with the lowest Total Costs also consistently paying the highest dividends.
This Total Costs method can also be used to evaluate primary producers of other commodities, such as copper and oil. Start using it today and you can find out how many $dollars per barrel of oil you are really getting from an oil producer.
I hope you found this analysis of Total Costs helpful. It is a simple way to cut through the "red tape" of mining costs and uncover what will ultimately have an important influence on share prices over time.
Disclosure: I/we have no positions in any stocks mentioned, and no plans to initiate any positions within the next 72 hours. I wrote this article myself, and it expresses my own opinions. I am not receiving compensation for it (other than from Seeking Alpha). I have no business relationship with any company whose stock is mentioned in this article.
Additional disclosure: I'm an investment advisor and owner of True Vine Investments, a Registered Investment Advisor in the State of Pennsylvania (U.S.A.). I screen electronic communications from prospective clients in other states to ensure that I do not communicate directly with any prospect in another state where I have not met the registration requirements or do not have an applicable exemption. Any investment advice or recommendations involving securities referenced in this article is general in nature and geared towards a readership of sophisticated investors. This article does not involve an attempt to effect transactions in a specific security nor constitute specific investment advice to any particular individual. It does not take into account the specific financial situation, investment objectives, or particular needs of any specific person who may read this article. Individual investors are encouraged to independently evaluate specific investments and consult a licensed professional before making any investment decisions. All data presented by the author is regarded as factual; however, its accuracy is not guaranteed. Investors are encouraged to conduct their own comprehensive analysis. Positive comments made regarding this article should not be construed by readers to be an endorsement of my abilities to act as an investment advisor.