What is the “Dummy Definition” of Worthless?In my view, 2019 Q4 was probably the last complete “untainted pre-Covid19 Plandemic” fiscal Quarter for Gold producers. Based on data from
Aurum Analytics, who collects gold mine production and costs data primarily from Australia and New Zealand, we can see that Australia essentially produced 2,540 koz of gold in 2019 Q4
https://www.aurumanalytics.com.au/images/Australia-Production_2019_Q4.png 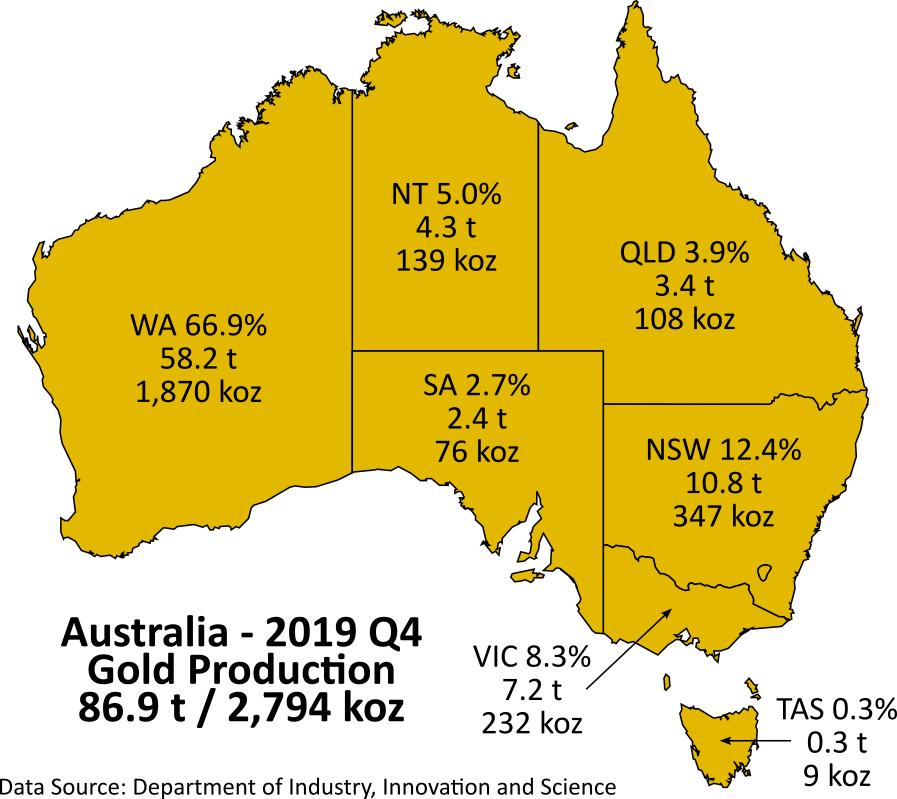
And the Top 10 producers were as follows:
https://www.aurumanalytics.com.au/images/2019_Q4_Mid_Tiers_Top_10.png 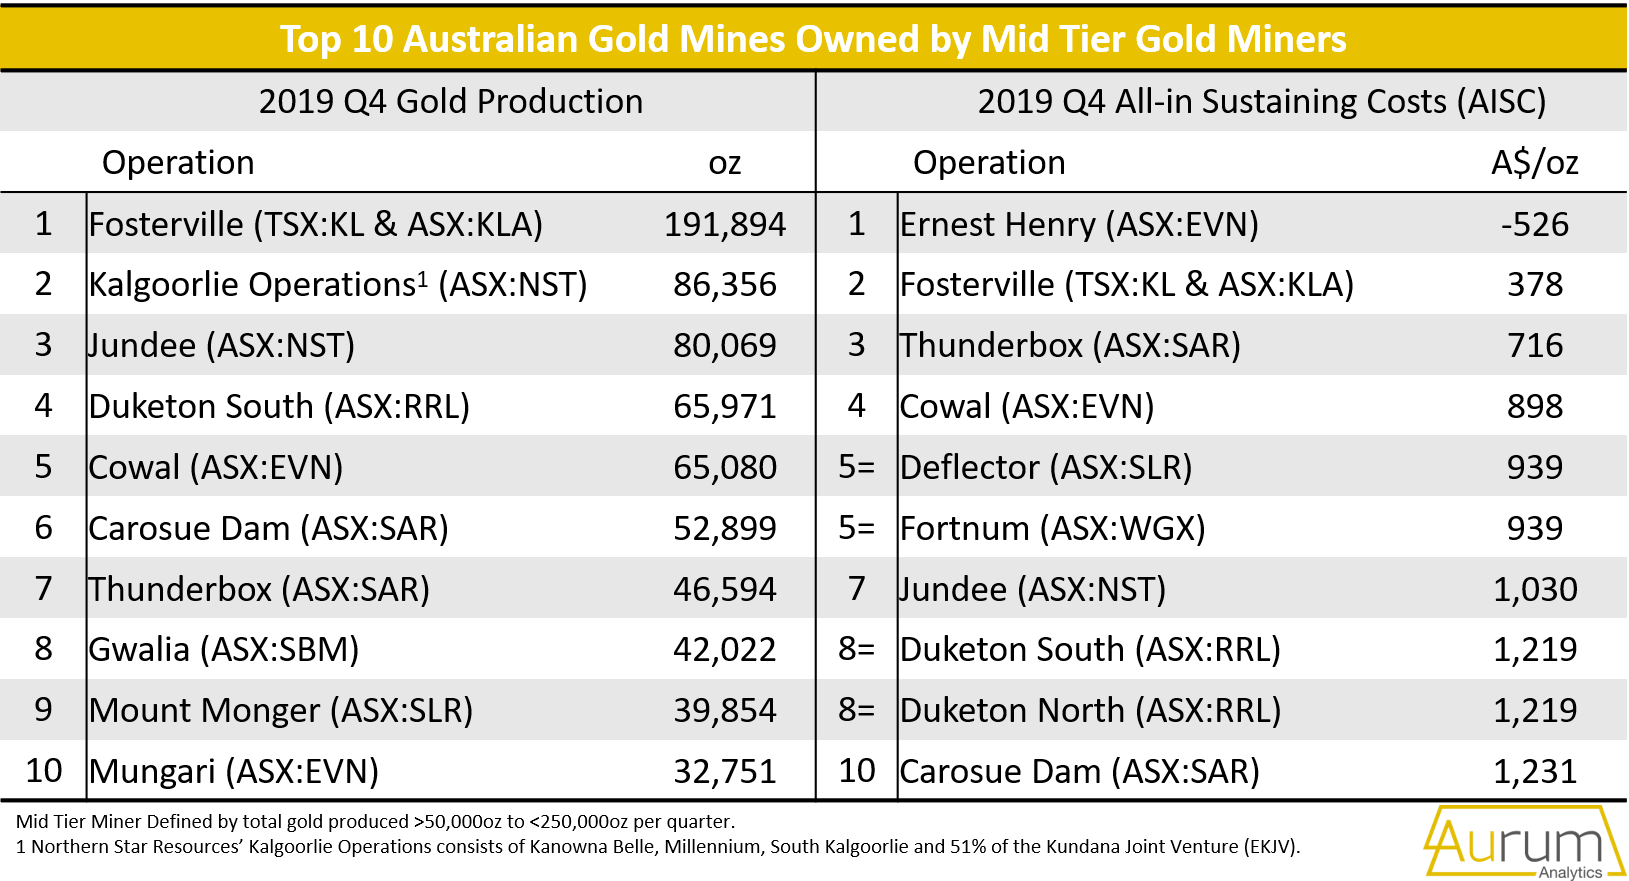
But the Aurum Analytics
Australian & New Zealand Gold Operations for December Quarter 2019 – (link) Final Report reveals some other fascinating figures regarding Australian gold production.
The average All-in Sustaining Cost (AISC) for Australia and New Zealand was A$1,338/oz, which is up 0.2% (A$3/oz) on the previous quarter average AISC of A$1,335/oz. Evolution Mining’s part of the Ernest Henry operations was the lowest cost producer reporting an AISC of A$-526/oz followed by Newcrest’s Cadia Valley operations with an AISC of A$208/oz, then by Kirkland Lakes' Fosterville mine (A$378/oz). The average gold spot price for the quarter was A$2,168/oz (US$1,482/oz).
It should be noted that Ernest Henry and Cadia Valley benefit from significant base metal by-products. Aurum Analytics’ estimate of these operations AISC on a co-product basis (Co- AISC) is as follows; Ernest Henry Co-AISC of A$791/oz and Cadia Valley Co-AISC of A$755/oz. The lowest cost “gold only” operations were Kirkland Lakes' Fosterville mine with an AISC of A$378/oz, then Saracen's Thunderbox mine (A$754/oz) and Evolution's Cowal mine (A$898/oz).
Newcrest’s Cadia Valley operation took out top spot as Australia’s largest gold producer with 239,722 oz for the quarter, followed by Newmont's Boddington (196,000 oz) then Kirkland Lake's Fosterville operation (191,894 oz). Of the mines where gold is a by-product, BHP’s Olympic Dam produced the most gold 35,382 oz followed by OZ Minerals' Prominent Hill with 35,102 oz and Evolution's part of Ernest Henry with 23,080 oz.
Grade wise for the companies that report AISC, the average reported mill head/feed grade was 3.69 g/t (Open Pit (OP) - 1.26 g/t, Underground (UG) – 5.95 g/t, Open Pit & Underground (OP/UG) - 2.44 g/t) which was up on the previous quarter, 3.59 g/t (2.7%). Kirkland Lake’s Fosterville mine again took out the honour as the operation with the highest average feed grade with 49.30 g/t, followed by St Barbara’s Gwalia mine 7.30 g/t.
The lowest grade mine was Evolution’s Ernest Henry processing an average head grade of 0.61 g/t. The high-grade operations that do not report an AISC were Mandalay Resources’ Costerfield mine with 6.80 g/t and LionGold Corp's Ballarat mine with 4.50 g/t.
Evolution Mining’s (ASX:EVN) share of the Ernest Henry operations was the lowest cost producer, reporting an AISC of NEGATIVE $-526/oz followed by Newcrest Mining’s (ASX:NCM) Cadia Valley operations with an AISC of $208/oz. Both these operations boast average gold grades of 0.61 g/t and 1.19 g/t respectively. Note: Both these operations benefit from significant base metal by-products, which lower their Gold AISCs dramatically.
If you remove the base metals credits out of the equation, the lowest cost “gold only” operations were Kirkland Lake Gold’s (ASX:KLA) Fosterville mine with an AISC of $378/oz (49.3g/t), then Alkane Resources’ (ASX:ALK) Tomingley mine at $1441/oz (1.21g/t) and Saracen’s (ASX:SAR) Thunderbox mine at $754/oz (2.1g/t).
We can grades vary wildly for these producers. The reason is that there are clearly other factors involved besides grade. Here is the 2019 Q4 listing for Australian producers with profitable mining operations below 2.5 g/t gold grade grades:
Mine Type:
UG = Underground
OP = Open Pit
| Operation | Company | Mine Type | AISC (A$/oz) | Grade (g/t) | Au Produced (oz) | |
| Ernest Henry | Evolution Mining Limited | UG | -526 | 0.61 | 23,080 | |
| Cadia Valley | Newcrest Mining Limited | UG | 208 | 1.19 | 239,722 | |
| Thunderbox | Saracen Mineral Holdings Ltd | OP/UG | 754 | 2.1 | 46,594 | |
| Cowal | Evolution Mining Limited | OP | 898 | 1.11 | 65,080 | |
| Tropicana | JV AngloGold/IGO | OP | 1,030 | 2.12 | 133,932 | |
| Gruyere | JV Gold Fields/Gold Road | OP | 1,043 | 1.1 | 70,023 | |
| Mt Magnet Ops | Ramelius Resources Limited | OP/UG | 1,182 | 2.33 | 37,956 | |
| Duketon South | Regis Resources Limited | OP | 1,219 | 1.55 | 65,971 | |
| Duketon North | Regis Resources Limited | OP | 1,219 | 1.11 | 24,877 | |
| Mungari | Evolution Mining Limited | OP/UG | 1,344 | 2.29 | 32,751 | |
| Boddington | Newmont Corporation | OP | 1,351 | 0.69 | 196,000 | |
| Tomingley | Alkane Resources Limited | OP | 1,441 | 1.21 | 6,929 | |
| Dalgaranga | Gascoyne Resources Limited | OP | 1,488 | 0.73 | 16,781 | |
| Edna May | Ramelius Resources Limited | OP/UG | 1,512 | 0.85 | 9,946 | |
| Macraes Ops | OceanaGold Corporation | OP/UG | 1,521 | 1.18 | 45,505 | |
| Matilda-Wiluna | Blackham Resources Limited | OP/UG | 1,527 | 2.2 | 20,003 | |
| Ravenswood | Resolute Mining Limited | UG | 1,589 | 0.69 | 15,351 | |
| Cue | Westgold Resources Limited | OP/UG | 1,627 | 1.89 | 17,757 | |
| Kalgoorlie | JV Newmont/Barrick/Saracen | OP/UG | 1,688 | 1.5 | 115,000 | |
| Mt Morgans | Dacian Gold Limited | OP/UG | 1,737 | 1.5 | 33,235 | |
| Telfer | Newcrest Mining Limited | OP/UG | 1,755 | 0.87 | 103,155 | |
| Mt Rawdon | Evolution Mining Limited | OP | 1,815 | 0.86 | 20,338 | |
| Sunrise Dam | AngloGold Ashanti Limited | UG | 2,069 | 1.75 | 58,000 | |
| Plutonic | Superior Gold Inc | UG | 2,084 | 1.77 | 20,084 | |
| Mt Carlton | Evolution Mining Limited | OP | 2,182 | 2.09 | 9,787 | |
| Peak | Aurelia Metals Limited | UG | 3,079 | 1.12 | 4,206 | |
| | | | | Total | 1,432,063 | oz |
| | | | | Total | 1,432 | koz |
This data also reveals another interesting fact: If we go up to the first image of this post and the list above, we can see that approximately
56 % of Australian Gold 2019 Q4 production came from low grade operations (below 2.5 g/t). What is also notable is that a significant portion came from higher cost Underground (UG) operations.
Out of the Top 5 Pure Gold Producers (No Base Metal By or Co-Products), two on the above “low grade” list ranked in the #3 and #4 spot.
Rank Operation AU oz Produced
3 Tropicana 133,932
4 Kalgoorlie 115,000
Out of the Top 5 Pure Gold Operations (No Base Metal By or Co-Products), two on the above “low grade” list ranked in the #2 and #3 spot for the lowest AISCs.
Rank Operation A$/oz AISCs
2 Thunderbox 754
3 Cowal 898
While retail investors are often impressed by high-grade mines that crank out the ounces, they should realize that gold-mining is like any other business: revenues must exceed costs. The point is, costs matter. These
6 main costs can be generalized as follows: depth of deposit; strip ratio; open pit vs underground; labor; infrastructure; and recovery method.
Open pit / Surface vs underground
Of utmost importance to the cost of extracting gold is where the gold lies within a deposit. A deposit of disseminated gold (small particles of gold distributed throughout the rock) close to surface will be open-pit mined, while gold found in often-thin veins hundreds of meters below surface is mined using underground methods. There are many more low-grade gold deposits than high-grade. For every 2.5 grams per tonne (g/t) gold deposit, Mother Nature forms another 10 deposits around 1 g/t. Generally speaking, one gram per tonne works for open-pit mines, but underground gold mines require at least 2.5 g/t to be economic.
Depth of deposit
The most famous of the world’s shallow deposits is the Carlin Trend in Nevada. Here microscopic gold is found in almost every rock. The gold is low-grade (under one gram per tonne) but plentiful. Between 1835 and 2008 a whopping 152 million ounces was pulled from the Carlin Trend and other gold trends in Nevada, including Cortez and Walker Lane, mostly through open-pit mining. Some Nevada pits are now depleted and have moved underground.
Strip ratio
The strip ratio is the amount of waste rock, or overburden, that must be removed in order to get to the mineralized rock (ore). The strip ratio is calculated by dividing the thickness of the overburden by ore thickness. Eg. if the overburden is 100m thick and the ore is 50m, the strip ratio is 2:1. The lower a strip ratio, the more profitable the mine will be, since less material needs to be moved.
Infrastructure:
There are hundreds of gold deposits around the world that will never be developed because they lack access to infrastructure – power, water and roads – making them too expensive. Both exploration companies and investors should recognize this at an early stage as a possible fatal flaw. Mines located close to population centers do not need to fly workers in and out, their supply lines are short, and they can tap into an existing electricity grid rather than paying for a new power line and servicing it.
Labor:
Labor represents the largest component of a mining operation, approximately 50% in developed countries. Of course, Labor costs are cheaper in some countries, and when combined with a weak currency, this can significantly widen a company’s margins. In contrast, rising currency values versus the US dollar squeeze margins.
Gold recovery costs:
Extracting gold from ore can be complicated and countless mines have failed because they did not recover enough gold to balance input costs. Refractory ore is more difficult and expensive to process due to the presence of sulfide minerals, which block the cyanide solution. Even with a large mineral deposit, the metallurgy can be challenging if the ore is refractory.
The lesson for investors is clear: don’t make the mistake of judging a mine or pricing a junior developer purely by its production numbers and/or grades. Of greater importance are a healthy cash flow and low-cost structure, which allows a company with capital discipline to reap the rewards of a high gold price when times are good, but protect its margins when the price takes a hit.
Which brings us all around about back to where a “Dummy” cries out WORTHLESS. Or even when another “Dummy” cries out JACKPOT. Unless one is intimate with all the factors (and data examples) stated above, they will continue to remain a "Dummy", regardless of what they think they know.
Being dummy is OK for an investor under one specific condition: The company in question possesses superior management that has executed on the stated tasks, and it has your back. That's what you're really betting upon.
Tx