The Nasdaq Biotechnology Equal Weight Index.
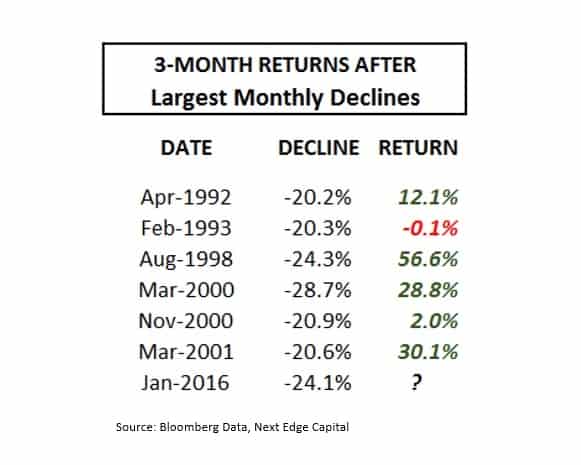
January witnessed a rare and dreadful month where biotech indices fell over -20%, and most biotech stocks fell much more. In fact, January was the seventh monthly decline exceeding -20% in past 27 years.
Having the wounds to prove I have managed this wild stallion of a sector through every environment, nevertheless, my long term Healthcare (+26% 9-year CRR) and RBC Growth Fund 5-year 5-star performance (1998-2003) was earned by managing these volatile assets through four such epic monthly declines (Aug 98, Mar 00, Nov 00 and Mar 01). It was not fun, but it always represented opportunity.
We have now seen the negative side of volatility in spades. But volatility works in both directions. Over the same 27 year period, there have been 15 months that appreciated over 20%, a ratio of 2:1.
As difficult as it is to weather such storms, in all prior six such monthly declines, the sector was flat or positive one quarter later.
ANYTHING BUT NORMAL
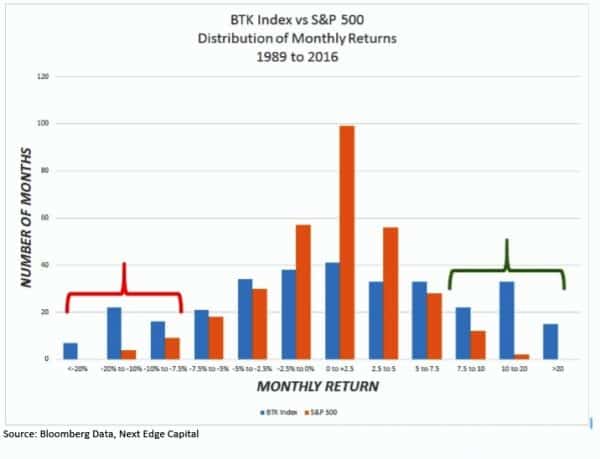
As can be seen from the distribution of monthly returns for Biotech vs the S&P, Biotech is characterized by ‘Fat Tails’ in abundance vs the normal distribution for the S&P. Such dispersion of returns is the footprint of Biotech that must overcome binary events and high barriers-to-entry on the path to enormous profit growth. In fact, 7% of months experience a + or – 20% return vs 0 for the S&P, while an eye-opening 24% of months experience a + or -10% return vs 2% for the S&P.
GROWTH IN A SLOW-GROWTH ECONOMY
The investing world flounders in search of growth that is not economically sensitive, fleeing to the ever crowded high-ground in mega-cap Technology titans. In the meantime, Biotech continues to innovate and advance breakthroughs at an accelerating rate.
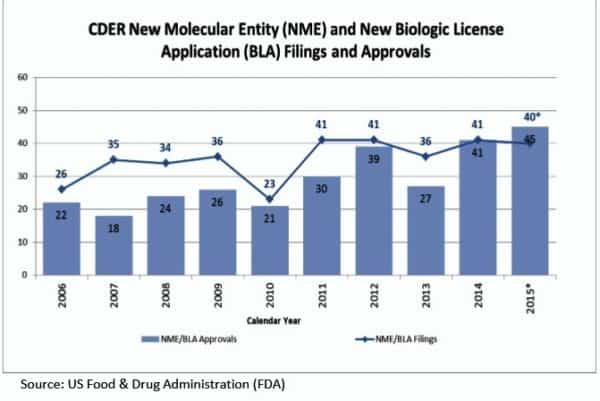
During the five year period 2006-to-2010, an average of 22 New Molecular Entities (NME) were approved each year. As the decade turned, and the biotech bull began, that average rose to 32 approvals per year over 2011 to 2013.
In the past two years, it has again accelerated to a record 45 during 2015. Given what we know about the pipeline of innovative products in late stage development, that rate of product approvals is likely to continue.
CALLING ALL CONTRARIANS
While investors seldom have the emotional resolve to step-up and Buy when an asset class is declining with impunity, that is when Technical indicators can shine a light on appropriate points to attempt. In particular, a) Oversold Indicators b) Sentiment Indicators c) Valuation indicators d) Long term trend (Secular Bull or Secular Bear?)
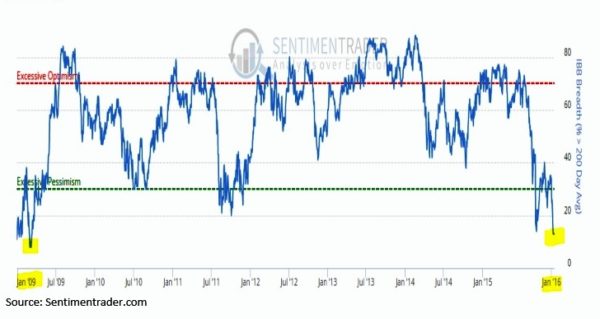
The percent of 150 Nasdaq Biotech index component stocks above their 200-day moving averages has decline to the lowest reading at 13% in 7 years since the bear market depression low in March 2009 when a reading of 8% was registered.
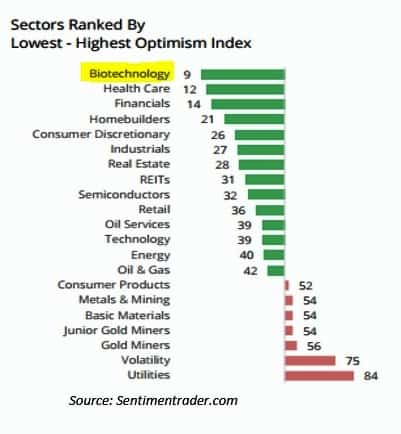
Furthermore, sentiment toward the sector has declined to the most bearish of all asset classes, making positive surprises that much more impactful. With readings so rare it confirms the proverbial elastic band is indeed stretched.
Sectors Ranked By Lowest-Highest Optimism
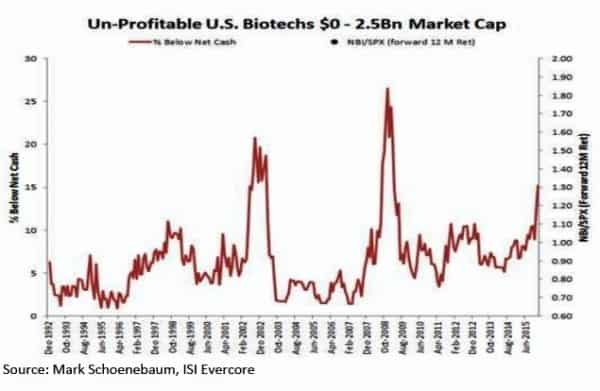
Finally, the percent of Nasdaq biotech index stocks trading for ‘Zero Pipeline’ or negative enterprise value is approaching 20% – the 3rd highest reading in 25 years. That was eclipsed only by the 22% and 27% readings registered at the depths of the multiyear bear markets that troughed in 2002 and 2009. Collectively, these oversold indicators point to a healthy Risk / Reward set up in a sector that is in a long term secular bull market.