Join today and have your say! It’s FREE!

Become a member today, It's free!

We will not release or resell your information to third parties without your permission.
Please Try Again
{{ error }}
By providing my email, I consent to receiving investment related electronic messages from Stockhouse.

or

Sign In

Please Try Again
{{ error }}
Password Hint : {{passwordHint}}
Forgot Password?

or

Please Try Again {{ error }}

Send my password

SUCCESS
An email was sent with password retrieval instructions. Please go to the link in the email message to retrieve your password.

Become a member today, It's free!

We will not release or resell your information to third parties without your permission.
Quote  |  Bullboard  |  News  |  Opinion  |  Profile  |  Peers  |  Filings  |  Financials  |  Options  |  Price History  |  Ratios  |  Ownership  |  Insiders  |  Valuation

American Future Fuel Corp T.EVG


Primary Symbol: C.AMPS Alternate Symbol(s):  AFFCF

American Future Fuel Corporation is a Canadian based resource company. The Company’s business is to acquire, explore, and develop interests in mining projects. The Company is focused on the strategic acquisition, exploration and development of alternative energy projects. The Company holds a 100% interest in the Cebolleta Uranium Project, located in Cibola County, New Mexico, USA, and situated within the Grants Mineral Belt, a prolific mineral belt responsible for approximately 37% of all Uranium produced in the United States of America. The Company’s Ceboletta Uranium project is an advanced exploration project. Its subsidiaries include 1344726 B.C. Ltd., 1344726 Nevada Ltd., American Future Fuel USA LLC, Cibola Resources LLC, Elephant Capital Corp., and Evolving Gold Corporation.


CSE:AMPS - Post by User

Bullboard Posts
Post by basserdanon Apr 09, 2010 12:33pm
608 Views
Post# 16974711

The Intra-Day Pattern in Gold Trading

The Intra-Day Pattern in Gold Trading

Posted by Jesse at 12:18 AM
09 April 2010

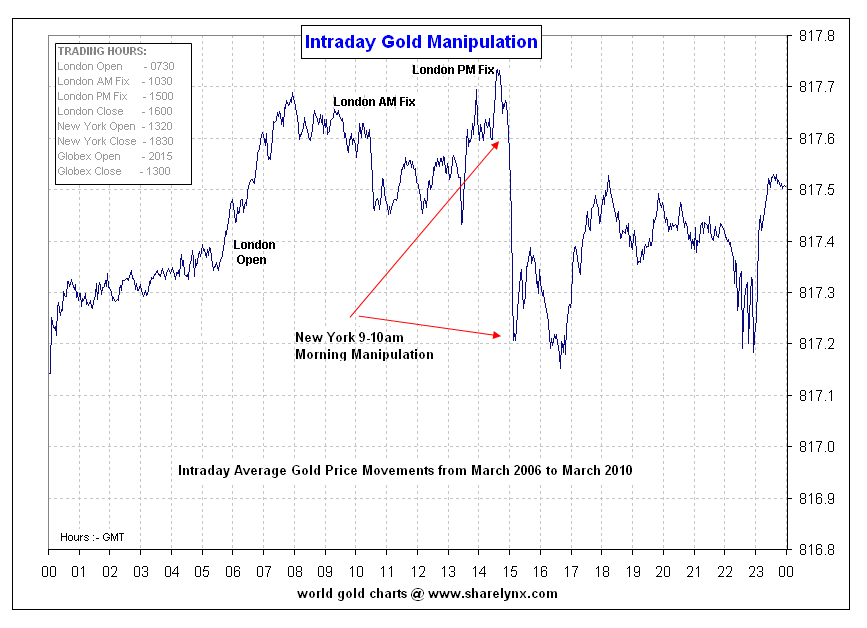
Nick Laird at sharelynx.com ( https://tiny.cc/ktl0f } was kind enough to share this chart with us.

It shows the average pattern of gold trading intraday.

Nick has an amazing array of current and historic charts at his site, including many vintage charts from a variety of markets.

The pattern here seems a big regular. I have found it to be useful in picking entry points in certain positions.

Intraday Average Gold Price Movements from March 2006 to March 2010


Posted by Jesse at 12:18 AM
https://jessescrossroadscafe.blogspot.com/2010/04/intra-day-pattern-in-gold-trading.html


Dan
Bullboard Posts