It has been a wild week for crude oil. Technical analyst Clive Maund reviews the trends.
Last week was a wild one for crude oil, which saw it make a throwover breakout and spike vertically to make it to the very top of a broad zone of resistance, so now is a good time to review it.

As we know, the shadow or true government of the world is now the World Economic Forum, which has its “plants,” otherwise known as “Young Global Leaders,” such as Prime Minister Justin Trudeau in Canada, President Emmanuel Macron in France, and Prime Minister Jacinda Ardern in New Zealand. As Klaus Schwab freely admits, they have infiltrated and control most governments and countries of the world. You may have seen the WEF’s famous advertisement proclaiming that “You will own nothing, and be happy.” The reason that you will own nothing is that they plan to bankrupt you and appropriate your assets, if you survive their current biowarfare attack.
One effective way to extract wealth from the population is to continually hike the price of energy, which will be good for the planet of course because as energy gets more expensive people will use less and less of it. A continued ramping up of the price of gasoline will push consumers in the direction of electric vehicles, and drivers of electric vehicles are more easily controlled and less independent. So, taking these motives into consideration, it is easy see why the price of energy is set to stay high and if anything, continue to increase. Clearly the war in the Ukraine plays to these objectives.
Now we will proceed to look at a range of charts for light crude.
Starting with the long-term 20-year chart, we see that oil has sliced through the resistance up to the $115 level with remarkable ease. You may recall that in the last update posted in the middle of January, we had expected oil to work its way through the considerable resistance up to this level, but in a more measured manner. However, back then we didn’t know that Russia would invade Ukraine which has clearly acted as a catalyst over the past couple of weeks. With respect to Russia’s invasion of Ukraine, the situation is not expected to ease, it is expected to worsen with Russia probably moving steadily to take over much or all of the country in the face of NATO and the U.S. trying to impede it and create as many problems for Russia as they can. It is a very dangerous situation that could even lead to a nuclear exchange, especially of course if NATO attempts to enter western Ukraine of bombs Russian convoys. Meanwhile, there is considerable risk of China moving against Taiwan, which they will view as reclaiming their territory.
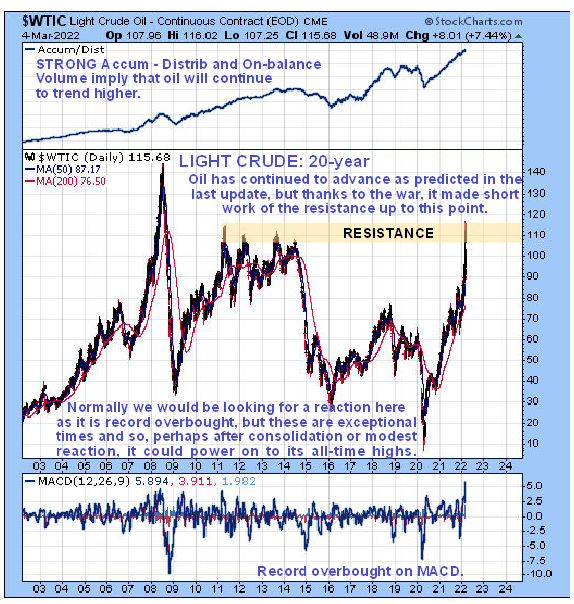
Turning back to the 20-year chart we see that oil is at a critical juncture as it has made it to the very top of a broad band of resistance, but very quickly so that it is now in a record overbought state. While this would normally call for reaction/consolidation, these are not normal times at all so, perhaps after pausing to allow the overbought condition to ease, oil could continue to spike even higher towards its old highs in the $150 area. It’s a paradoxical situation, as although wildly overbought, its action thus far is very bullish which means it could continue to ascend vertically for a while.
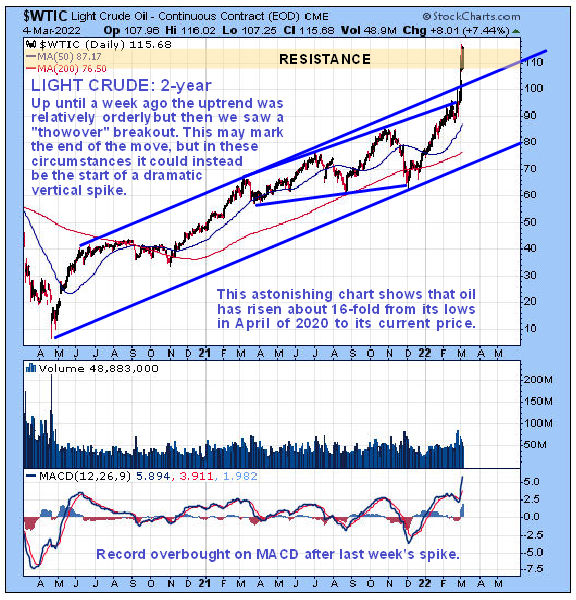
Our next chart is the two-year, a period selected to draw to your attention the truly extraordinary percentage gains made by oil from its freak lows in April 2020 to the present. Within this period, it has risen approximately 16-fold from its lows to where we are now, an incredible gain for a core commodity like oil. Up until just a week ago, oil had risen in a surprisingly orderly uptrend, but suddenly, early last week, it launched into a “throwover breakout,” spiking vertically to the very top of the broad band of resistance that we saw on the 20-year chart. Normally such breakouts mark the end of a move, but on occasion they instead mark the start of a spectacular vertical spike. Given what is going on in the world, there is a good chance that this is the case here, and if so we could see oil rapidly ascend to challenge its all-time highs above $150 that occurred way back in 2008. If we factor in the inflation that has occurred since that time, oil would have to go a lot higher than the $150 area to exceed its all-time highs in real terms.
On the four-month chart we can see all of the action so far this year and how, after a relatively steady ascent, oil blasted vertically higher for four days. A move that took it out of the uptrend channel in force from April 2020. This move has resulted in it becoming record overbought on its MACD indicator and very overbought relative to its moving averages, a situation which would normally lead to reaction/consolidation. While this is what we would normally expect here, the exceptional circumstances driving this move, which as mentioned above may intensify, make it possible for it to spike even higher, especially as it has now almost gotten clear of a broad band of resistance that we saw on its 20-year chart.
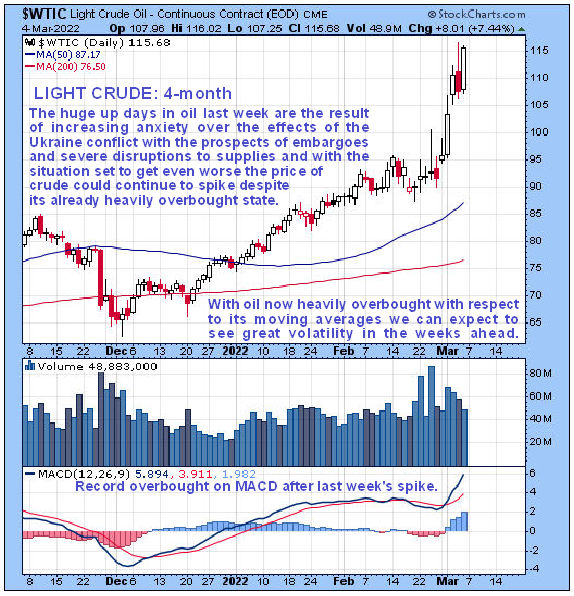
Whether oil pauses now to consolidate or perhaps react back, or spikes even higher, we should now expect to see great volatility which traders may be able to take advantage of.
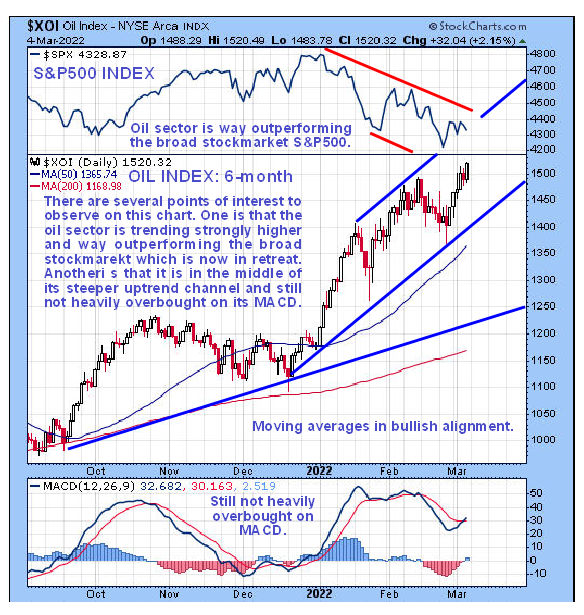
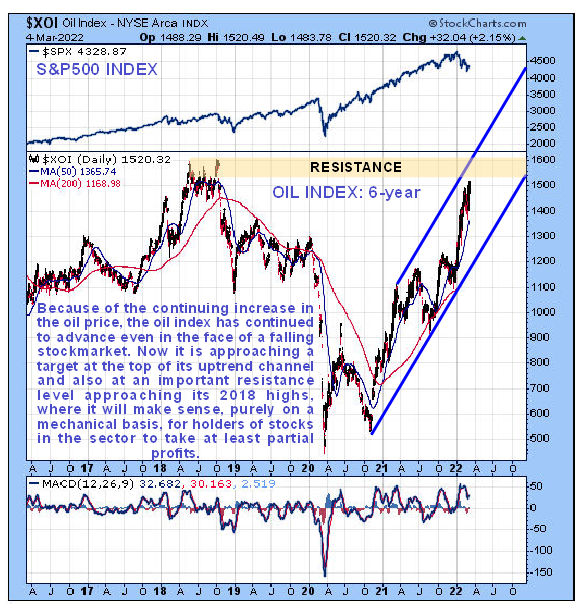
With respect to oil stocks, we can see on the latest six-month chart for the oil index that they have been doing well in recent weeks, and certainly a lot better than the stock market as a whole as is made clear by comparing this index to the S&P500 index which is at the top of the chart. The trend is definitely higher with moving averages in bullish alignment and a point to note is that this index is still not heavily overbought on its MACD indicator, which means that there is scope for further gains near-term.
The longer-term six-year chart for the oil index is certainly worth referring to, for on this chart we can see the fine strong uptrend in the sector and how the index is now approaching a double target at the top of this channel (which is different from the one we looked at on the six-month chart) and also at the top of the band of resistance associated with the 2018 peaks. So there is a high probability that the current advance will terminate or at least pause in this zone, which means that this will be a good target zone for holders of oil stocks to take at least partial profits.
Originally posted on CliveMaund.com Saturday, March 5, 2022.
Clive Maund has been president of www.clivemaund.com, a successful resource sector website, since its inception in 2003. He has 30 years' experience in technical analysis and has worked for banks, commodity brokers and stockbrokers in the City of London. He holds a Diploma in Technical Analysis from the UK Society of Technical Analysts.