THE NEW ALBANY SHALE PETROLEUM SYSTEM
ABSTRACT
The data files and explanations presented in this report were used to generate published material-balance approach estimates of amounts of petroleum 1) expelled from a source rock, and the sum of 2) petroleum discovered in-place plus that lost due to 3) secondary migration within, or leakage or erosion from a petroleum system. This study includes assessment of cumulative production, known petroleum volume, and original oil in place for hydrocarbons that were generated from the New Albany Shale source rocks.More than 4.00 billion barrels of oil (BBO) have been produced from Pennsylvanian-, Mississippian-, Devonian-, and Silurian-age reservoirs in the New Albany Shale petroleum system. Known petroleum volume is 4.16 BBO; the average recovery factor is 103.9% of the current cumulative production. Known petroleum volume of oil is 36.22% of the total original oil in place of 11.45 BBO. More than 140.4 BBO have been generated from the Upper Devonian and Lower Mississippian New Albany Shale in the Illinois Basin. Approximately 86.29 billion barrels of oil that was trapped south of the Cottage Grove fault system were lost by erosion of reservoir intervals. The remaining 54.15 BBO are 21% of the hydrocarbons that were generated in the basin and are accounted for using production data.
Included in this publication are 2D maps that show the distribution of production for different formations versus the Rock-Eval pyrolysis hydrogen-indices (HI) contours, and 3D images that show the close association between burial depth and HI values.The primary vertical migration pathway of oil and gas was through faults and fractures into overlying reservoir strata. About 66% of the produced oil is located within the generative basin, which is outlined by an HI contour of 400. The remaining production is concentrated within 30 miles (50 km) outside the 400 HI contour. The generative basin is subdivided by contours of progressively lower hydrogen indices that represent increased levels of thermal maturity and generative capacity of New Albany Shale source rocks. The generative basin was also divided into seven oil-migration catchments. The catchments were determined using a surface-flow hydrologic model with contoured HI values as input to the model.
INTRODUCTION
In the 1990’s the material-balance approach to assessing petroleum resources was tested with a study of the New Albany Shale petroleum system in the Illinois Basin.An initial publication entitled “Feasibility Study of Material-Balance Assessment of Petroleum from the New Albany Shale in the Illinois Basin” by Lewan and others, USGS Bulletin 2137, 1995, indicated that this was a promising method of assessing oil and gas resources, and outlined the methodology.A second, “Material-balance assessment of the New Albany Shale-Chesterian petroleum system of the Illinois Basin” by Lewan and others, 2002, was published in the AAPG bulletin series and details the geology, methods of geochemical analysis, and results of the study.This open file report details the evaluation of the distribution and volumes of produced oil and gas, and includes maps and raw geochemical and other data that were used to generate but were not included in previous papers.The New Albany is assigned group rank in Illinois; in Indiana and western Kentucky the New Albany is a formation-rank unit.In this report, the name “New Albany Shale” will be used throughout the Illinois Basin.Highlighted text and graphics are links to figures and large-size images in which the sizes are approximately 16 by 16 inches and scales are 1:1,000,000.They may also be links to the glossary; most of the definitions are derived from the Dictionary of Geological Terms, 1984, Higley and others, 1997, and Klett and others, 2000.
The Illinois Basin is located in southwestern Indiana, western Kentucky, and all but northernmost Illinois. Major structural features in the basin and bounding areas are shown on figures 1 and 2. Times of structural activity are illustrated on figure 3. Petroleum production is concentrated along many of the major faults and other structures. About 42% of the almost 90,000 holes drilled are oil and (or) gas productive. Mississippian reservoirs provide 70% of the producing wells in the basin, which are equally split between Chesterian- and Valmeyeran-age formations. Approximately 60% of oil produced from the basin is from Chesterian reservoirs (Howard, 1991). Additional production is primarily from Valmeyeran (greater than 20%), Pennsylvanian (13%), and Silurian and Devonian (7%) reservoirs (Howard, 1991). A simplifying aspect of the New Albany Shale petroleum system is that almost all reported production is oil. Average gas to oil ratio for the Mississippian and Pennsylvanian producing formations is 750 cubic feet of gas per barrel (CFG/BBL) (Macke, 1996).
About 66% of the produced oil occurs within the area of thermally-mature New Albany Shale source rocks, which suggests the primary hydrocarbon migration direction was upwards through faults and fractures into overlying reservoir strata. Geochemical analyses of oil-field brines across the Illinois Basin indicate short migration distances (Abrams 1995) for these hydrocarbons that are probably sourced from the New Albany Shale; brines typically exhibit ionic composition of the (probable in-situ) seawater with ionic concentrations of as much as 5 times seawater. Long-range migration of formation fluids generally dilutes connate water. Abrams further postulates that density drive due to buoyancy was the primary mechanism of oil migration. The influence of lateral migration through porous carrier beds may be important in large oil fields such as Louden and Main Consolidated that lie near or outside the limit of mature source rocks in the Illinois Basin. The Fairfield Subbasin (Figure 1), within the Illinois Basin, contains most of the oil produced in the New Albany Shale petroleum system. Bordering the Fairfield Subbasin are the primary barriers and conduits to lateral migration of hydrocarbons (Figure 2); structures listed below also define some of the boundaries of catchments in the basin that influence hydrocarbon migration pathways and traps.
- The Rough Creek -Shawneetown fault system, near the southern boundary of the basin, is the northern boundary of the Rough Creek graben. This east-west trending fault system is a probable barrier to migration of hydrocarbons and is located just east of the Cottage Grove fault system.
- The Cottage Grove fault system is a series of right-lateral wrench faults (Nelson and Lumm, 1985) that mark the southern limit of significant oil and gas production in the western half of the basin. Approximately 98% of reported oil and gas production is located north of this fault system, based on analysis of production data from Nehring (1996), and PI/Dwights petroROM Production Data on CD-ROM (1996).
- The La Salle anticlinal belt is a primary barrier to eastward migration of hydrocarbons. This belt forms the northeast boundary of the Fairfield Subbasin and consists of sub-parallel north-south trending anticlines.
- The Wabash Valley fault system is located south of the La Salle anticlinal belt, along the Illinois/Indiana state line. This system was an important vertical and north-south oil migration corridor. Hydrocarbons accumulated in reservoir rocks adjacent to or between faults, and in upthrown blocks. In Indiana, oil commonly occurs within the fault system. Figure 4 and the detailedallprod.jpg map show oil and gas wells near this and the other structural features that outline the hydrocarbon generative area of the basin.
- Westward migration of hydrocarbons was slowed by the Louden and Salem anticlines and by the Du Quoin monocline. This monocline dips steeply to the east and forms the western edge of the Fairfield Subbasin. The faulted monocline near the western terminus of the Cottage Grove system appears to have focused oil migration northward. The two largest fields in the basin are located on the Salem and Louden anticlines, which are north of and approximately on strike with the Du Quoin monocline. Seismic data revealed that the Louden anticline is faulted on both flanks and that these faults may extend to the basement (Nelson, 1991). Only minor amounts of oil exist in Mississippian reservoirs west of the monocline suggesting that faults and other structural features served as barriers to westward migration.
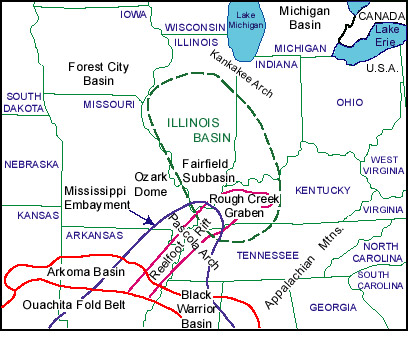
Figure 1. Index map of major structural features in the eastern mid-continent of the United States (Modified from Buschbach and Kolata, 1991, reprinted by permission of the American Association of Petroleum Geologists and AAPG Data Systems (Datapages, Inc.), whose permission is required for further use). Green dashed line is generalized outline of the Illinois Basin. The large 1,343 KB image is named indexmp.jpg .
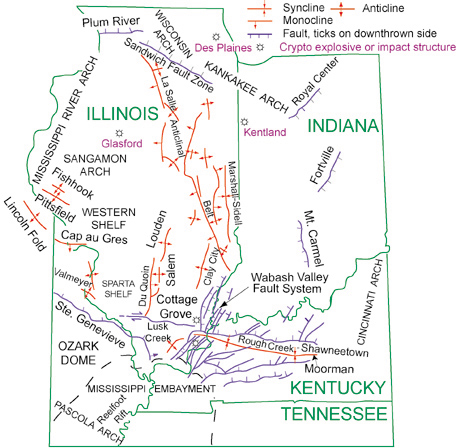
Figure 2. Major structural features of the Illinois Basin and bounding areas. Shown are major fault systems, anticlines, synclines, monoclines, and crypto explosive or impact structures in the region (modified from Buschbach and Kolata, 1991; Treworgy, 1981, reprinted by permission of The American Association of Petroleum Geologists and AAPG Data Systems (Datapages, Inc.), whose permission is required for further use).
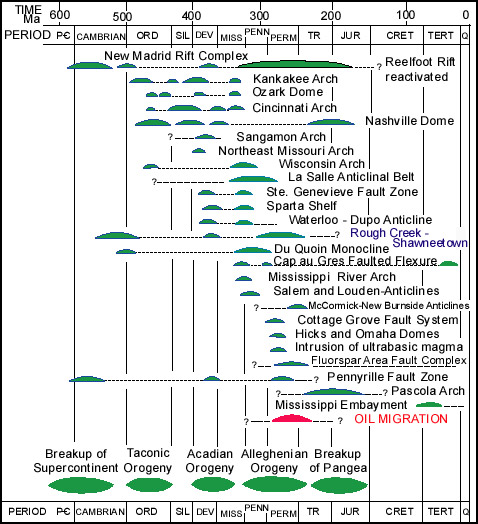
Figure 3. Chart showing times of structural activity in the Illinois Basin area. Illustrated are major structural events in the region and plate tectonic movement across the world. These are plotted on a numerical time scale from the COSUNA chart that was modified by Shaver and others (1985). Diagram is modified from Kolata and Nelson (1991, reprinted by permission of The American Association of Petroleum Geologists and AAPG Data Systems (Datapages, Inc.), whose permission is required for further use). The large 159 KB image is named agestru.jpg .
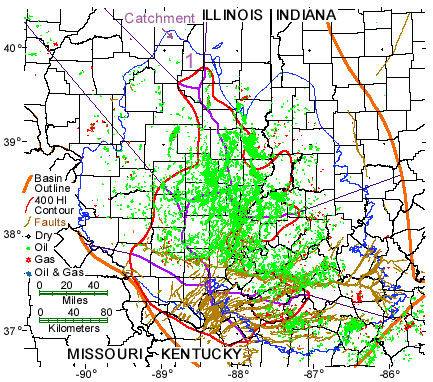
Figure 4. Distribution of oil and gas wells from Silurian- through Pennsylvanian- age reservoirs in the Illinois Basin; approximate basin outline is marked by a thick orange line. The thin red line shows region of thermally mature source rocks. Major structural features are labeled; fault names are black text while blue text marks arches, monoclines, synclines, and domes. Catchment 1 is labeled and catchments 2 through 7 are located clockwise and sequentially from 1. Faint purple lines segregate each catchment.The irregular blue line outlines maximum subsurface and surface extent of Chesterian-age formations. The large 753 KB image is named oilstruc.jpg . The small-scale image without the labeled structures is named allprod.jpg .
The New Albany Shale was deposited as brownish-black laminated shales in a marine, stratified anoxic basin; primary environments were transitional shelf, slope, and basin (Cluff and others, 1981). Time span of New Albany Shale deposition to possible completion of hydrocarbon migration is Late Devonian through Late Jurassic, about 225 m.y. Hydrocarbon expulsion in southern Illinois began during the Middle Pennsylvanian and reached its peak in Late Pennsylvanian to Early Permian time (Cluff and Byrnes, 1991). Extensive folding and faulting coincident with this event created many of the major structural traps in the basin (Figure 3).A late stage of hydrocarbon migration probably occurred during tectonic activity after maximum burial depth (post-Early Permian) (Figure 3) (Lewan and others, 2002); however this was minimal as indicated by the fact that about 66% of petroleum production is from within the generative basin, and only 2% of hydrocarbon production is from south of the Cottage Grove and Rough Creek-Shawneetown fault systems.
Bethke and others (1991) state that migration of hydrocarbons into traps began during Early Cretaceous time (100 Ma).Bethke and others (1991) suggest that long-range, northward, migration of hydrocarbons (100 km (62 mi.) or more) resulted from uplift during Mesozoic time of the Pascola Arch, located along the southern boundary of the Illinois Basin. They further postulate that oil generated from the Devonian and Mississippian New Albany Shale migrated through underlying Devonian and Silurian carbonates along a karstified surface of a regional unconformity. They doubt the oil migrated over long distances along faults; they indicate the central basin contains few fault systems, and none are believed oriented along their inferred migration routes. Primary migration mechanisms were attributed to hydrodynamic flow and buoyancy. Fluid expulsion is also associated with sediment compaction.
Emplacement of hydrocarbons was influenced by their vertical migration along fault systems, combined with potential sealing effects of some faults and associated structures. Results of this migration include vertical expansion of the petroleum system into overlying younger formations, and limiting the lateral migration and extent of oil and gas by sealing faults and low-permeability formations. Erosional removal of potential reservoir units was particularly widespread south of the Cottage Grove fault system (Figure 4). During this time an estimated 1-3 km (0.6 to 2 mi.) of section in southern Illinois was removed (Cluff and Byrnes, 1991; Damberger, 1971). This was determined based on extrapolation of trends in thicknesses of Paleozoic strata across the basin, and by anomalous values of thermal maturity in near-surface coal beds.
The New Albany Shale petroleum system was divided into seven migration drainage areas, or catchments. Petroleum charge, losses, and in-place resources were evaluated separately for each catchment, both within and outside the generative basin. Catchments and hydrocarbon migration pathways were determined using surface hydrologic modeling utilities in the Arc/Info geographic information systems (GIS) software mapping program (Environmental System Research Institute, Inc., 1997). Because decrease in hydrogen index (HI) values is associated with an increase in thermal maturity, the HI contour map resembles a depression. In order to model movement of hydrocarbons under buoyant forces by using hydrologic flow modeling software, the model must be inverted. The HI values for each of the 262 locations were multiplied by minus one. These negative HI values were then used as input to the watershed modeling utility in the Arc/Info program. Regions of source rocks that are thermally mature for oil generation are defined by a 400 HI contour (Figure 5); this is also the limiting polygon for calculation of amounts of generated hydrocarbons. HI values within the thermally mature portion of the basin range from 10 to 400 mg/g TOC (Appendix 2, HI_TOC.xls).The study area was initially divided into 21 drainage regions, or catchments. These were condensed into seven catchments by combining drainage areas that had ambiguous boundaries. Petroleum production data was calculated using these 21 catchments, and the data were merged into the final 7 catchments. Boundaries between catchments were extended to the New Albany Shale subcrop/outcrop by drawing perpendicular lines outward from the 400 HI contour.
The 400 HI contour generally follows the structure of the Fairfield Subbasin. The 100 HI contour outlines an area of higher thermal maturity in southern Illinois.Maximum lateral movement along the Cottage Grove fault systems is less than one mile (Nelson and Krausse, 1981) and is not associated with noticeable displacement of HI contours.
The regions of the Illinois Basin that are thermally mature for oil and gas that was sourced from the New Albany Shale are shown on figures 5 and 6 a-g. Figures 6a through 6g are 3-D images of hydrogen indices contoured across the basin; these HI contours are draped on the top of the New Albany Shale to better show the association between HI and the basin structure. Surfaces are offset by movement along major fault systems. Maps are based primarily on results from Rock-Eval pyrolysis of 475 samples from 262 locations across the Illinois Basin. Multiple samples from the same location were averaged. The thermally mature area includes the Fairfield Subbasin (400 HI red contour) (Figure 4). Contoured values greater than 400 HI are not displayed; these areas are thermally immature for oil generation. Data files that list HI, TOC, well location, and other information are located in the data subdirectory. The files are stored in Microsoft EXCEL ( HI_TOC.xls), comma-delimited ( HI_TOC.csv), and space-delimited (HI_TOC.prn) formats.Fileform.htm contains an example and explanation of data and methods.
The following are factors that influenced the generation and migration of hydrocarbons from the New Albany Shale and were used in our analyses:
- Thermal maturity is primarily a measure of burial depth at the time of hydrocarbon generation and expulsion.
- Petroleum migrates vertically under buoyant forces. Permeability barriers mainly deflect the movement laterally, but in an up-dip direction.
- General features of petroleum migration were modeled using a structure contour map of elevation of the top of the New Albany Shale. This structure was used as input to a hydrologic flow modeling computer program that was modified to account for flow behavior of hydrocarbons.
- The basin configuration is such that impermeable layers that are encountered by migrating hydrocarbons will have similar geometry to the top of the New Albany Shale.
- Existing pathways, such as faults and fractures, allowed for mostly vertical migration of hydrocarbons from the New Albany Shale into overlying porous and permeable reservoirs. Vertical barriers were hundreds of feet of generally dense limestone and lesser amounts of shales of the Chesterian and Valmeyeran Series (Figures 7, 8).
Vertical relationship of New Albany Shale to primary reservoir intervals is shown on the stratigraphic column of Devonian and Mississippian strata in the southern part of the Illinois Basin (Figure 7). Formations that are oil productive are marked by horizontal red lines.Figure 8 is a generalized stratigraphic cross section of this time interval. Also shown is the extent of Chesterian and Valmeyeran Series across the basin. Regressive depositional cycles for the Chesterian and Valmeyeran Series were tied to well-log signatures and lithologic descriptions (Treworgy and Devera, 1991).
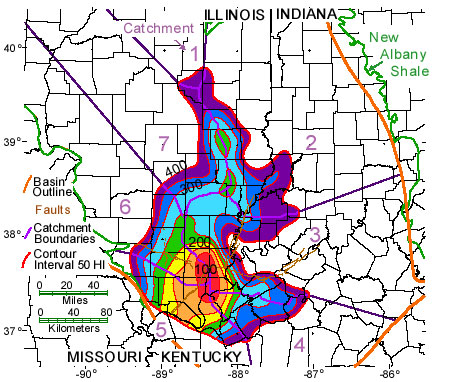
Figure 5. Decreasing hydrogen index (HI) contours show regions of increasing thermal maturity of New Albany Shale source rocks within the Illinois Basin. Contour interval is 50 HI. The 400 HI contour (red line) outlines the area of source rocks that are thermally mature for oil generation. Catchments are labeled clockwise from 1 to 7. Irregular dark-green line outlines the maximum extent of the New Albany Shale (modified from Lewan and others, 1995, 2002). Large scale 525 KB image is named contorhi.jpg .
Figure 6 a through g. Below are a series of 3-D images of hydrogen indices (HI) values cut by structure on the top of the New Albany Shale. HI contours show location of the generative basin as outlined by a HI of 400. Major fault traces are shown in red on some views. Vertical displacement by the faults is illustrated in shades of gray. Vertical exaggeration is 20 times. "LS" marks the La Salle anticlinal belt and "RC" labels the Rough Creek fault zone on some images. Included are north arrows and azimuth relative to north (degrees), and inclination relative to a horizontal plane (degrees). Small-size images are 28 to 55 KB, and the enlarged images are 86 to 190 KB.
 Figure 6a. nalb115.jpg
 Figure 6b.nalb111.jpg
 Figure 6c.nalb110.jpg
 Figure 6d.nalb112.jpg
 Figure 6e.nalb116.jpg
 Figure 6f . nalb114.jpg
 Figure 6g.nalb113.jpg .
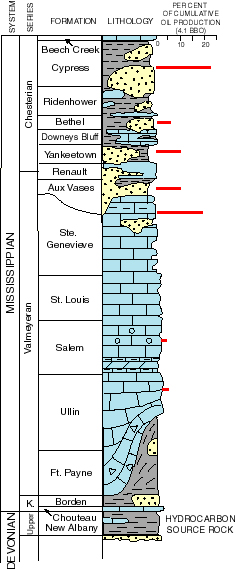
Figure 7. Generalized stratigraphic column of Devonian and Mississippian strata in the southern part of the Illinois Basin. Horizontal red lines to the right of the column indicate the primary oil and gas productive intervals. Shown are names and vertical and lateral associations of strata from Late Devonian to Late Mississippian time. The New Albany Shale hydrocarbon source rock is also labeled (Modified from Bell and others, 1961; Buschbach and Kolata, 1991, reprinted by permission of The American Association of Petroleum Geologists and AAPG Data Systems (Datapages, Inc.), whose permission is required for further use). The large 161 KB image is named stratsec.jpg .
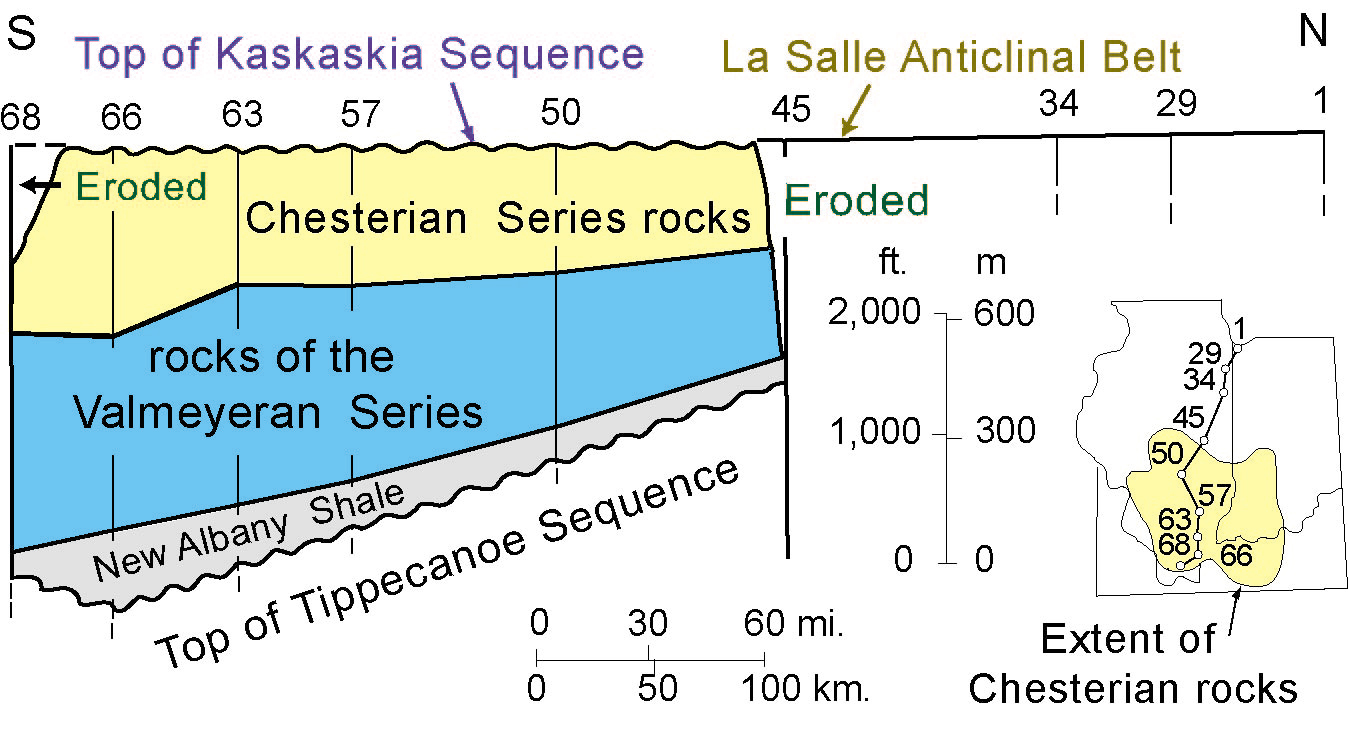
Figure 8. This generalized southwest-northeast stratigraphic cross section of the Middle Devonian through Mississippian Kaskaskia sequence shows vertical and lateral extent of primary hydrocarbon source rock and reservoir rocks in the Illinois Basin (modified from Treworgy and Devera, 1991, reprinted by permission of The American Association of Petroleum Geologists and AAPG Data Systems (Datapages, Inc.), whose permission is required for further use).
DISTRIBUTION OF OIL, GAS, AND NON-PRODUCTIVE WELLS
Petroleum Production in the Basin
The Clark County Division field was drilled in the Illinois Basin in 1900; this is the first field that contains discovery date information in the PI/Dwights databases (1996, 1999) and Nehring database (1996).Average discovery date is 1946 for 320 fields in the databases that contain this information. The Illinois Basin has a mature exploration status. Macke (1996) estimated that 10 or fewer oil accumulations of 1 million barrels or greater remain to be discovered in Mississippian and Pennsylvanian formations in the basin and that remaining reserve growth will mainly result from secondary and tertiary methods of petroleum production from existing fields.The basin contains more than sixty different petroleum pay intervals that range in age from Ordovician to Pennsylvanian; production is primarily from structural traps at depths of less than 5,500 ft (1,675 m) (Howard and Whitaker, 1990). "A number of hydrocarbon occurrences are closely related to the tops of three major carbonate intervals"; these are listed by Howard (1991) as being the Upper Ordovician Ottowa Supergroup, the Silurian and Devonian Hunton Supergroup, and the Mississippian Valmeyeran Series. Most hydrocarbon production in the basin has been from siliciclastic intervals in Chesterian and Pennsylvanian rocks (Howard, 1991). Oltz and others (1991) determined that the Illinois Basin has almost 1,700 fields; these produce mainly oil from about 7,000 separate sandstone and carbonate reservoirs. Ninety-six percent of this production is stripper, or less than 10 BO/day per well; this percentage is six times greater than the national average for stripper production (Oltz and others, 1991). Organic geochemical correlations indicate that more than 99% of discovered petroleum in the basin was derived from the New Albany Shale (Hatch and others, 1991).
Almost 90,000 wells have been drilled in the Illinois Basin; 42%, or about 38,000 wells, are currently listed as oil and (or) gas productive (PI/Dwights WHCS data through Dec, 1996). Total number of dry holes across the basin is 47,800 (PI/Dwights WHCS database through 1996).Figure 4 shows distribution of oil and gas wells across the basin. Production is from Silurian-through Pennsylvanian-age reservoirs.
Distribution of Oil, Gas, and Non-Productive Wells
The following maps show areal distribution of oil and gas wells and dry holes (non-productive wells) in the Illinois Basin. The primary source of well data for the well distribution figures is the PI/Dwights Well History Control System data through 1996. The smooth solid red line on figures is the 400 HI contour; this outlines the hydrocarbon generative area of the New Albany Shale as defined by a hydrocarbon index value of 400. Purple lines within the generative basin segment the seven catchments; perpendiculars are extended to the boundaries of the formation or basin. Labeled outcrop/subcrop extents are generalized in areas, particularly south of the Rough Creek and Cottage Grove fault systems and along the southwestern border of the basin.
Numerous wells produce from several different age and (or) formation intervals and production is commingled; allocation of percentages of total production can therefore be somewhat misleading. This can result in over- or under-reporting of production data. Production from Pennsylvanian-age formations is illustrated on figure 9.Approximately 13% of basin production is from Pennsylvanian-age reservoirs according to Howard (1991).More than 4,700 mostly oil wells produce from Pennsylvanian formations; this is 7.8% of total oil and gas wells in the basin (PI/Dwights WHCS data, 1996).Seventy-five percent of Pennsylvanian production is concentrated along the north-south trending La Salle anticlinal belt (Swann and Bell, 1958).The largest field is Main Consolidated, which is the large crescent-shaped field that overlies the anticlinal belt and the 400 HI contour in catchment 2 (fig. 9).Dry hole maps are useful to show the concentration of drilling across the basin.2,000 dry holes that reach total depth within Pennsylvanian-age formations are concentrated in the area of Main Consolidated field (crescent shape in catchment 2 on Figure 10) and west of the area of thermally-mature source rocks.Almost 39,000 dry holes across the basin reach total depth in Mississippian-through-Devonian-age formations (Figure 11). This is about 60% of all wells drilled, an approximate percentage because some wells are reclassified as dry after they are shut in, others are misreported or underreported, and other factors tend to skew the data.
More than 13,800 wells are listed as productive from Chesterian reservoirs. This comprises 37% of all producing oil and (or) gas wells in the basin; almost 100% are oil wells. More than 33% of oil and gas wells in the basin produce from Valmeyeran age reservoirs; about 97%, or 12,600, are oil wells (PI/Dwights WHCS data, 1996). Sandstone reservoirs from the Chesterian and Valmeyeran are commonly interpreted as being from fluvial, deltaic, shoreline, or tidal depositional environments (Pryor and others, 1991). A typical Chesterian regressive depositional cycle ( Figure 12) begins at the base with a marine shelf-carbonate unit, followed by marine, shelf, or prodelta shale, and topped by a sequence of sandstone and shale from shoreline, tidal-bar, tidal-channel, delta or fluvial distributary, and lower delta-plain environments (Pryor and others, 1991). There are seven primary sandstone, shale, and carbonate lithofacies for Valmeyeran cycles (Pryor and others, 1991). A Valmeyeran regressive depositional cycle is shown on figure 13. Oil and gas wells from the Chesterian and the Valmeyeran Series are shown on figures 14 and15. Chesterian reservoirs account for about 60% of the oil produced from the basin (Howard, 1991). About 18% of basin oil production is from the Ste Genevieve Limestone and 2% from sandstones of the Salem Formation (Cluff and Lineback, 1981); these are the primary Valmeyeran reservoirs.
Distribution of production from Silurian and Devonian-age formations across the basin is illustrated on figure 16. These account for 2% and 5%, respectively, of oil reserves (Howard, 1991). There are about 3,000 oil and gas wells that produce from Silurian and Devonian reservoirs; which is about 12% of the total (PI/Dwights WHCS data, 1996). The scattered Silurian production is primarily in western and west-central Illinois. Devonian production is widely scattered; primary reservoirs are vuggy porous Geneva Dolomite. Minor amounts of natural gas may be present in the deep part of the basin as an untapped resource (Lineback, 1981).
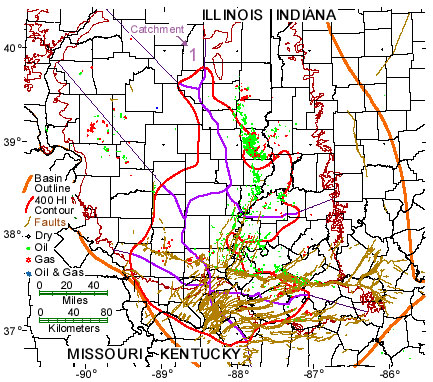
Figure 9. Distribution of more than 4,700 wells with petroleum production from Pennsylvanian-age reservoirs in the Illinois Basin. Catchment 1 is labeled and catchments 2 through 7 are located clockwise and sequentially from 1. Purple lines segregate each catchment.An irregular dark-reddish-brown line outlines the maximum extent of Pennsylvanian-age formations. Well location data were derived from PI/DwightsWell History Control System database (1996).The large 693 KB image is named pennprod.jpg.
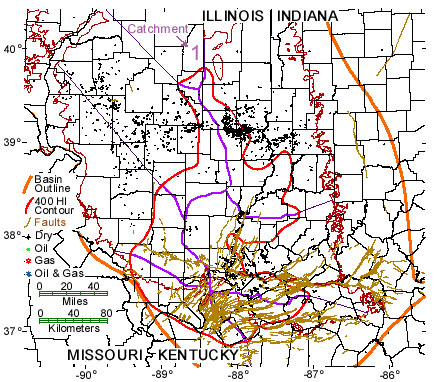
Figure 10. Shown are greater than 2,000 dry holes that reach total depth within Pennsylvanian-age formations. Catchment 1 is labeled and catchments 2 through 7 are located clockwise and sequentially from 1. Purple lines segregate each catchment.An irregular dark-reddish-brown line outlines the maximum extent of Pennsylvanian-age formations. Well location data were derived from PI/DwightsWell History Control System database (1996).The large 574 KB image is called penndry.jpg .
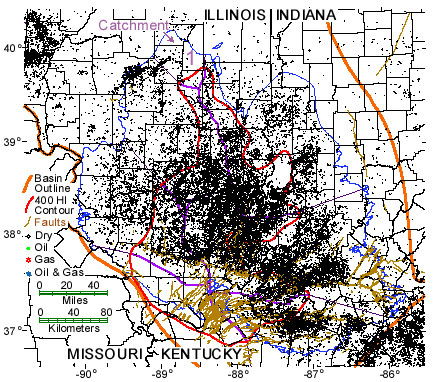
Figure 11. Shown are more than 38,000 dry holes that reach total depth within Mississippian-age or older formations. Catchment 1 is labeled and catchments 2 through 7 are located clockwise and sequentially from 1. Purple lines segregate each catchment.Subsurface or surface extent of Chesterian-age formations is outlined by the irregular blue line. Well location data were derived from PI/DwightsWell History Control System database (1996).The large 774 KB image is called missdry.jpg .
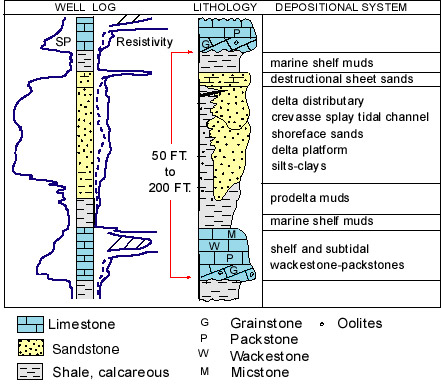
Figure 12. Chesterian regressive depositional cycle is modified from Pryor and others (1991, reprinted by permission of The American Association of Petroleum Geologists and AAPG Data Systems (Datapages, Inc.), whose permission is required for further use). Shown are spontaneous potential (SP) and resistivity well-log signatures, lithology, and depositional systems for an idealized shoaling-upward regressive system; most cycles are bounded by disconformities (shown by wavy horizontal lines). The large 122 KB image is named chesdep.jpg.
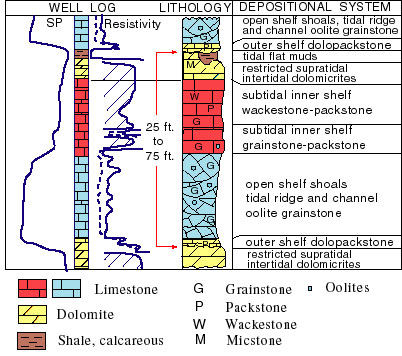
Figure 13. This Valmeyeran regressive depositional cycle is modified from Pryor and others (1991, reprinted by permission of The American Association of Petroleum Geologists and AAPG Data Systems (Datapages, Inc.), whose permission is required for further use). Shown are spontaneous potential (SP) and resistivity well-log signatures, lithology, and depositional systems for an idealized upward-shoaling regressive carbonate cycle. The large 143 KB image is named valmdep.jpg .
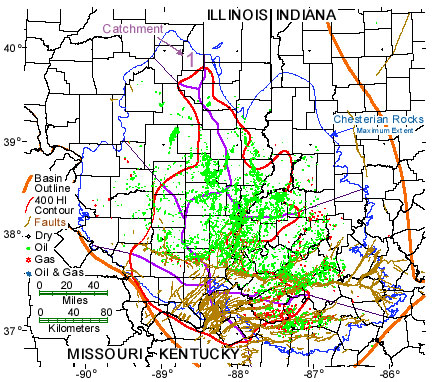
Figure 14. Distribution of petroleum production from Chesterian-age reservoirs in the Illinois Basin. Shown are more than 13,000 oil and 600 gas wells. Catchment 1 is labeled and catchments 2 through 7 are located clockwise and sequentially from 1. Purple lines segregate each catchment.The irregular blue line outlines the maximum extent of Chesterian-age formations. Well location data were derived from PI/DwightsWell History Control System database (1996).The large 633 KB image is named chesprod.jpg.
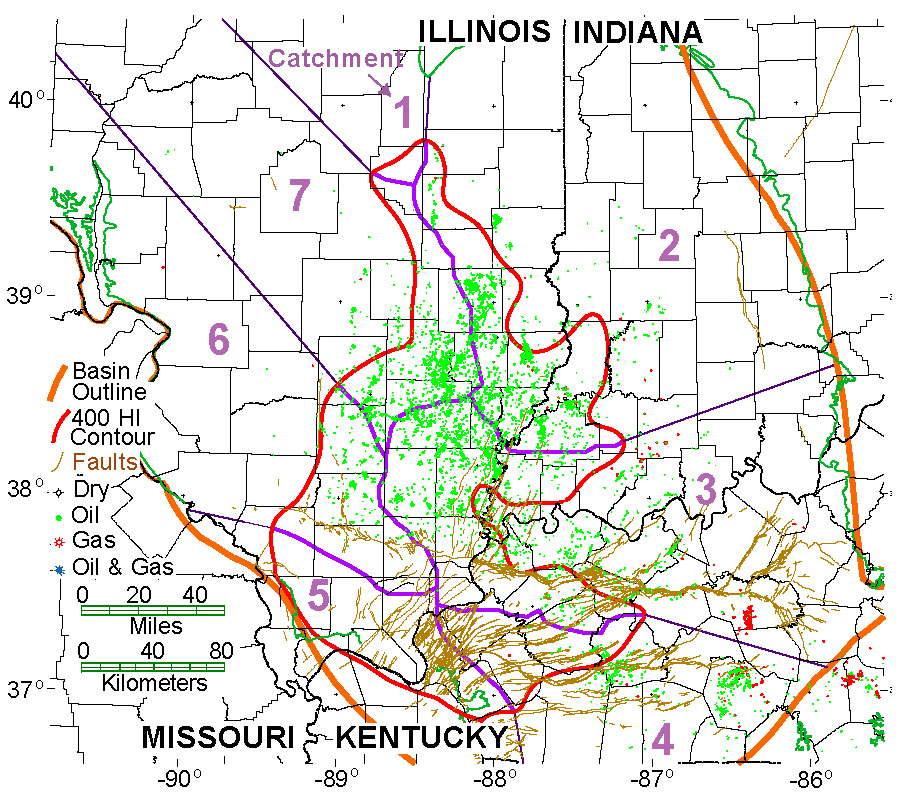
Figure 15. This map shows wells that produce from units within the Mississippian Valmeyeran Series. The catchments 1 through 7 are labeled. Purple lines segregate each catchment.The irregular dark-green line outlines the maximum extent of Valmeyeran-age formations. Primary producing formations are Ste. Genevieve, Salem, and Aux Vases. There are more than 12,000 oil wells (green) and 400 gas wells (red). Well location data were derived from PI/DwightsWell History Control System database (1996).The large 345 KB image is named valmprod.jpg .
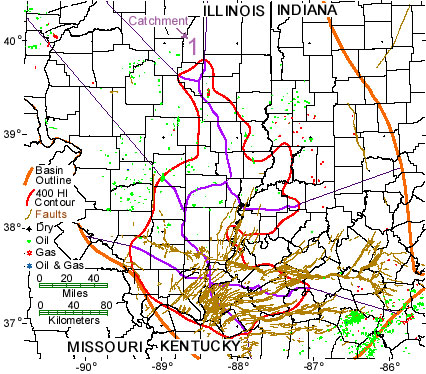
Figure 16. Distribution of oil and gas wells from Silurian- and Devonian-age formations. Shown are more than 2,700 oil and 100 gas wells. Catchment 1 is labeled and catchments 2 through 7 are located clockwise and sequentially from 1. Purple lines segregate each catchment.Well location data were derived from PI/DwightsWell History Control System database (1996).The large 502 KB image is named sildprod.jpg.