Join today and have your say! It’s FREE!

Become a member today, It's free!

We will not release or resell your information to third parties without your permission.
Please Try Again
{{ error }}
By providing my email, I consent to receiving investment related electronic messages from Stockhouse.

or

Sign In

Please Try Again
{{ error }}
Password Hint : {{passwordHint}}
Forgot Password?

or

Please Try Again {{ error }}

Send my password

SUCCESS
An email was sent with password retrieval instructions. Please go to the link in the email message to retrieve your password.

Become a member today, It's free!

We will not release or resell your information to third parties without your permission.
Quote  |  Bullboard  |  News  |  Opinion  |  Profile  |  Peers  |  Filings  |  Financials  |  Options  |  Price History  |  Ratios  |  Ownership  |  Insiders  |  Valuation

ALX Resources Corp V.AL.P


Primary Symbol: V.AL Alternate Symbol(s):  ALXEF

ALX Resources Corp. owns interests in a diverse portfolio of mineral properties and explores for nickel-copper-cobalt, uranium, and gold in Canada, and VMS in Scandinavia. The company executes programs using the latest technologies integrated with available historical data for maximum exploration value. Its projects include Falcon Nickel and Hook-Carter uranium in Saskatchewan, Vixen Gold in Ontario and Draco VMS in Norway


TSXV:AL - Post by User

Bullboard Posts
Post by InvestorOon May 10, 2017 10:56pm
141 Views
Post# 26229513

Nexus Gold - Gold’s Next Move ?

Nexus Gold - Gold’s Next Move ?

Gold is currently trading near a critical level from where a massive move up or down is imminent. One of the measures that illustrate we are close to a big move is the following resistance line on the gold chart that I have highlighted.

Below is a gold chart with the resistance line indicated:

gold price and US dollar

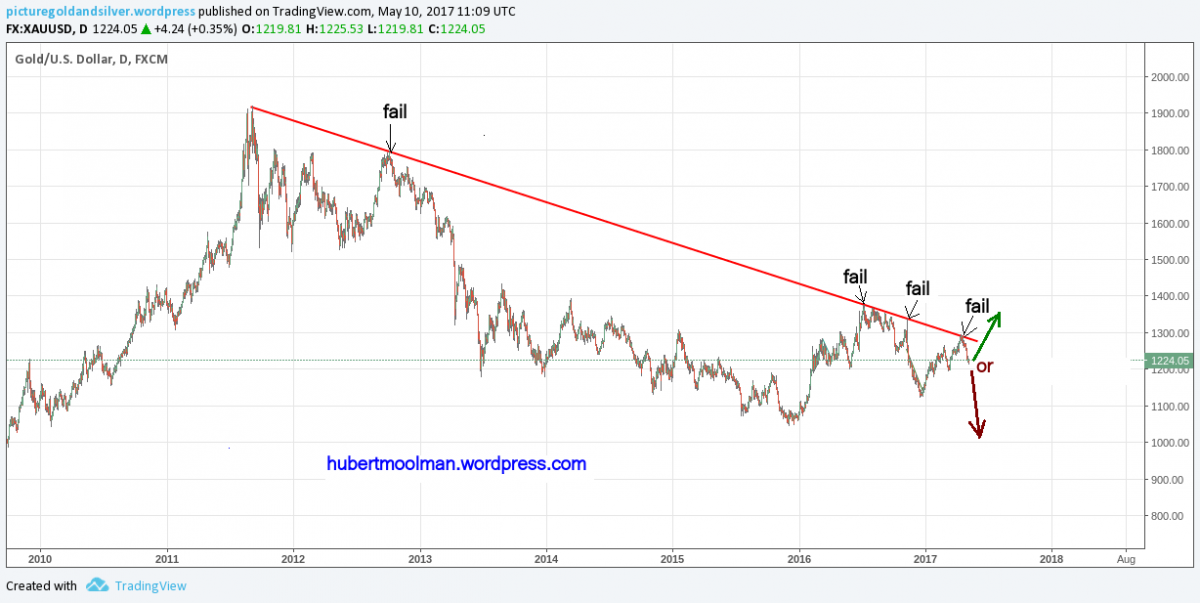
The red line is the critical obstacle that the gold price has to overcome to facilitate the continuation of the gold bull market. However, since price has now failed more than four times at that line, there is a great chance that we could see a big drop.

However, if the price is to turn around and break through the resistance line, then a great amount of energy is required to fuel such a move. This kind of energy can only come from a collapse of a big market like the general stock market, or the bond market.

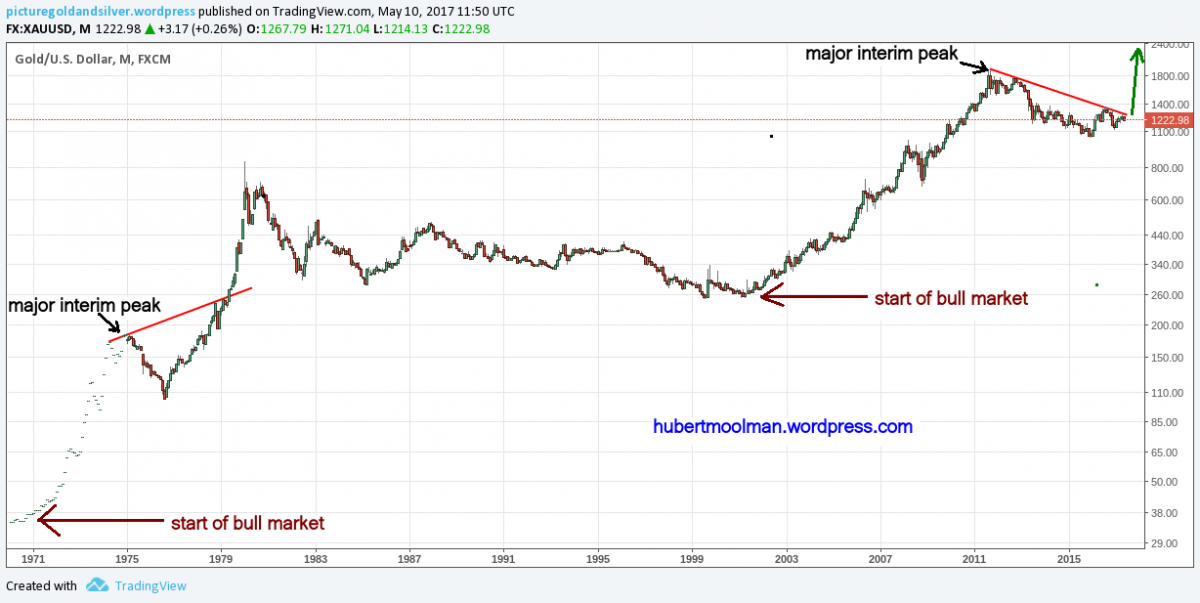
When gold breaks through the resistance line, we will see a gold rally like that of 1979/1980. In fact, there is a peculiar fractal that suggests the current situation for gold is very similar to that of May 1979, just before the massive rise in gold – see the following long-term gold chart (which is self-explanatory):

Bullboard Posts