Good news....there is light at the end of the tunnel..... Here are the 11 bone-chilling (Fed) things I (Aunty Miwah,lol) gleaned from the chart:
1. They have no clue about what might happen next. Their forecasts and “forward guidance” are either figments of their imagination or just efforts to manipulate the markets.
2. They have no clue how to get out of what initially was an emergency treatment of a Fed-sponsored financial system in full and self-inflicted collapse, but is now the “new normal” treatment for an economy buckling under its Fed-encouraged debt.
3. Even the confidence level in their cluelessness is only 70%. What about the other 30%? We’re better off not knowing.
4. NIRP be screwed. Negative interest rates are off the table. In footnote 2 and on the chart itself, Yellen points out the “effective lower bound of 12.5 basis points.” So the bottom in rates, at a 70% confidence level, is 0.125%.
5. NIRP is beyond even the new-normal central bank deviousness. Negative interest rates are so destructive even to Fed-coddled entities, such as the banks, that the Fed doesn’t want to try them.
6. Negative real interest rate policy is in. It has been around for a long time. This is when the federal funds rate and other interest rates, such as bank deposit rates and government bond yields, are negative after inflation. It’s the classic form of financial repression. It surreptitiously rips off savers and other low-risk investors as they can’t see the rip-off on their bank or brokerage statements. Now the favorite tool in the Fed’s insidious tool box.
7. Flip-flopping is now the official Fed policy at a 70% confidence level and will become part of “forward guidance.”
8. They have no clue, but they know how to talk. The chart confirms the Fed’s message: They say whatever they want to in order to inflate financial markets and drive even conservative investors into huge risks without much compensation, and that’s pretty much all they’ll ever do.
9. They don’t give one iota about the real economy. The verbiage about unemployment etc. is just pretext. It’s all about inflating financial markets, bailing out certain bondholders when they get in trouble, enriching those that hold the most assets – the “Wealth Effect,” as Bernanke called it – and serve Wall Street in every way to the maximum extent possible. And to heck with the real economy.
10. Labor is screwed. It doesn’t figure into the chart, except that there needs to be an unlimited supply of cheap labor. Because cheap labor makes bad consumers, the Fed said with this chart that they’ll encourage “cheap labor” to spend money they don’t have and fill the holes in their budgets by borrowing. This way, they’ll be good consumers and prop up the economy, while also enhancing their noble status as debt slaves.
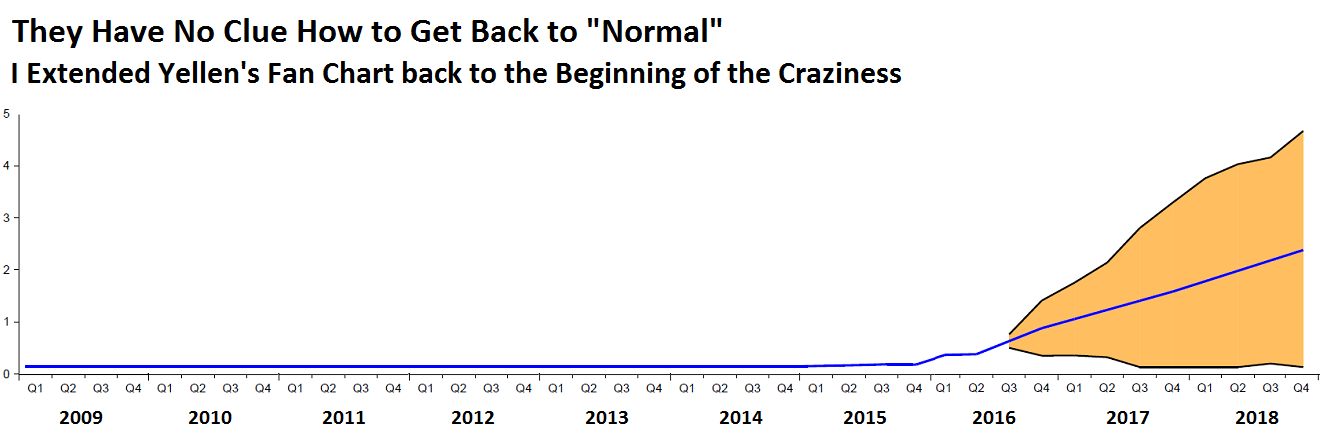
11. They’re trying to make us forget how long this insanity has been going on. Yellen’s chart begins in Q1 2015. But the Fed’s historic craziness began in 2008. So that we can remember for just how long the Fed has inflicted its policies on the economy, I have added to Yellen’s chart the prior six years, for a total of eight years. It shows that they have no clue about how to get back to normal, and that they have instead changed the definition of normal (click to enlarge):
Markets no longer believe that the Fed will ever raise interest rates in any significant way, at least not anytime soon, and with this very public belief, they’re trying to force the Fed not to raise rates. But if the Fed stops flip-flopping for a minute and actually raises rates, markets might throw a big hissy-fit, or so frets the Bank of Japan. Read… Bank of Japan Prepares for Crash Triggered by Fed Tightening
-----------------
Doomsday sceanrios are coming soon.....gold will shoot off the roof!!!! and EAS and Barisan will explode (beside the muslim terror in Miwah, oh well, that is another story)....and Gold is going to $5,000 per ouce....lol