Join today and have your say! It’s FREE!

Become a member today, It's free!

We will not release or resell your information to third parties without your permission.
Please Try Again
{{ error }}
By providing my email, I consent to receiving investment related electronic messages from Stockhouse.

or

Sign In

Please Try Again
{{ error }}
Password Hint : {{passwordHint}}
Forgot Password?

or

Please Try Again {{ error }}

Send my password

SUCCESS
An email was sent with password retrieval instructions. Please go to the link in the email message to retrieve your password.

Become a member today, It's free!

We will not release or resell your information to third parties without your permission.
Quote  |  Bullboard  |  News  |  Opinion  |  Profile  |  Peers  |  Filings  |  Financials  |  Options  |  Price History  |  Ratios  |  Ownership  |  Insiders  |  Valuation

New Found Gold Corp V.NFG

Alternate Symbol(s):  NFGC

New Found Gold Corp. is a Canada-based mineral exploration company. The Company is engaged in the acquisition, exploration, and evaluation of resource properties with a focus on gold properties located in Newfoundland and Labrador, Canada. The Company holds a 100% interest in the Queensway Project, which comprises an approximately 1,662 square kilometers area, located about 15 kilometers (km) west of Gander, Newfoundland and Labrador, and just 18 km from Gander International Airport. The Queensway Project is divided by Gander Lake into Queensway North and Queensway South. The Company also owns a 100% interest in the Kingsway property, which consists of 264 claims on three licenses covering approximately 77 square kilometers. The project is located approximately 18km northwest of the town of Gander, Newfoundland. The Company is undertaking a 650,000-meter drill program on Queensway. It has royalty interests underlying Keats South and several additional zones in Queensway.


TSXV:NFG - Post by User

Post by likeikeon Aug 18, 2021 7:32pm
197 Views
Post# 33728067

gold update

gold update


Gold Market Update - READY FOR NEXT MAJOR UPLEG & GREAT ENTRY POINT...

originally published Saturday, August 14, 2021

Printable Version

All Latest Gold Market Update

It’s been a long time since a full Gold Market update was posted on the site because frankly it has been too boring a market, but what happened last week looks highly significant with the action in gold and silver suggesting not just a reversal from the recent downtrend but the imminent start of a major upleg in both metals.

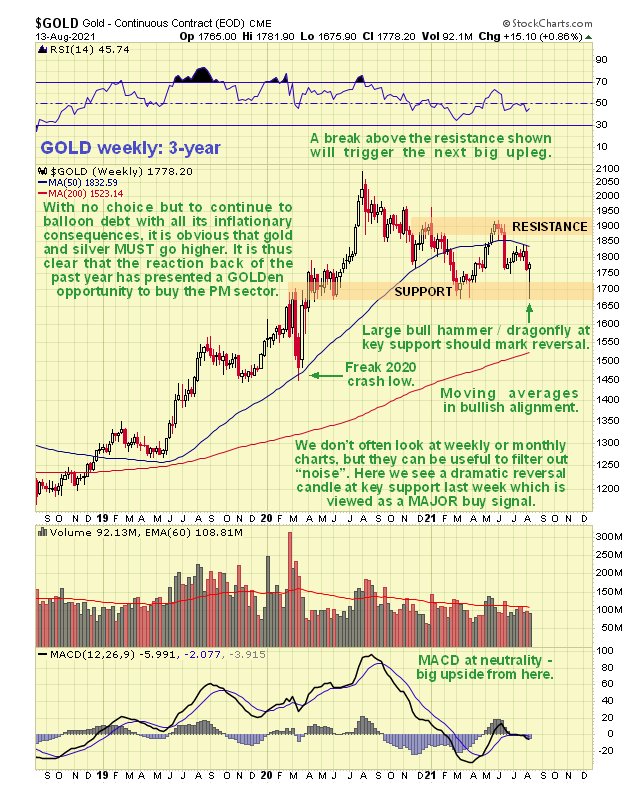
Although we don’t often use weekly or monthly charts, they are on occasion very useful for filtering out “noise”, with the latest weekly chart for gold in particular showing a large dragonfly / hammer reversal candle, as we can on its latest 3-year chart below. Most notably this reversal candle formed exactly at a zone of strong support above the rising 200-day moving average which is coming into play beneath. This strongly suggests that gold’s corrective phase is over– and why shouldn’t it be considering the enormous inflation being incubated by the Fed and other Central Banks around the world, who are behind the lockdowns which are among other things designed to kill the velocity of money so that they can print vast sums of money to buy up everything without immediately triggering hyperinflation. There doesn’t appear to be any end in sight to the enormous money creation at least for now, which serves the purpose of accelerating wealth transfer up to the top of the pyramid, so it seems very unlikely that we will see a repeat of the March 2020 crash over the short to medium-term.


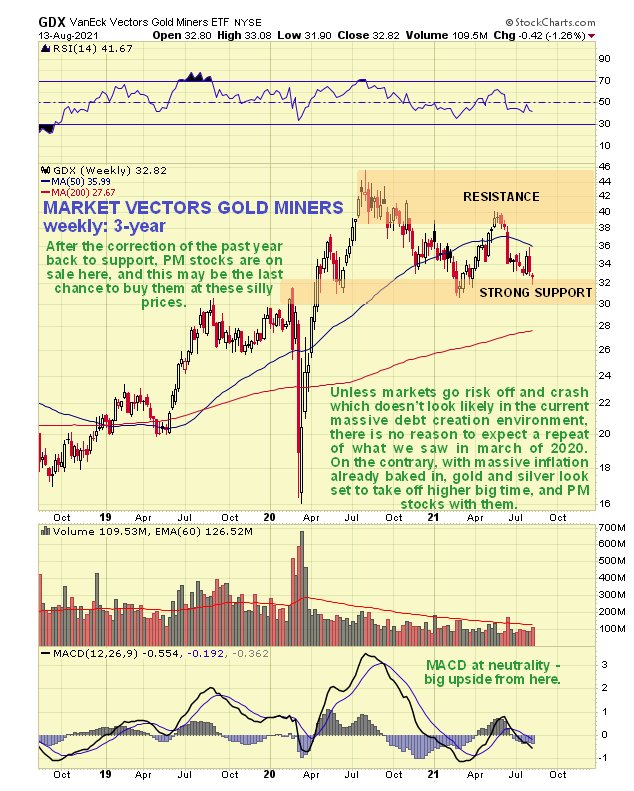
If gold takes off higher to begin a major new upleg, then it follows that gold and silver stocks should do likewise, and we can see on the latest 3-year weekly chart for GDX that it is position to do just that. The setup looks very similar to that for gold itself and therefore no further discussion is necessary, save to say that this looks like a great entry point for the sector.


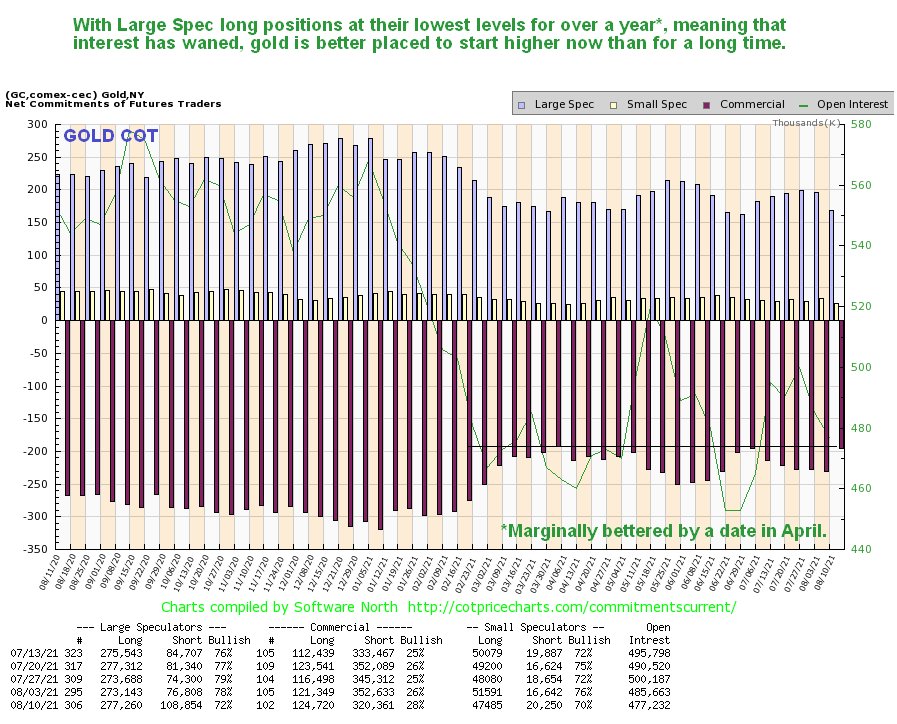
What about gold’s COTs – are they conducive to a rally? On gold’s latest COT chart we can see that Commercial short positions and Large Spec long positions are at their lowest levels for at least a year (jointly with a date in April) which shows lack of interest that typically precedes a rally.


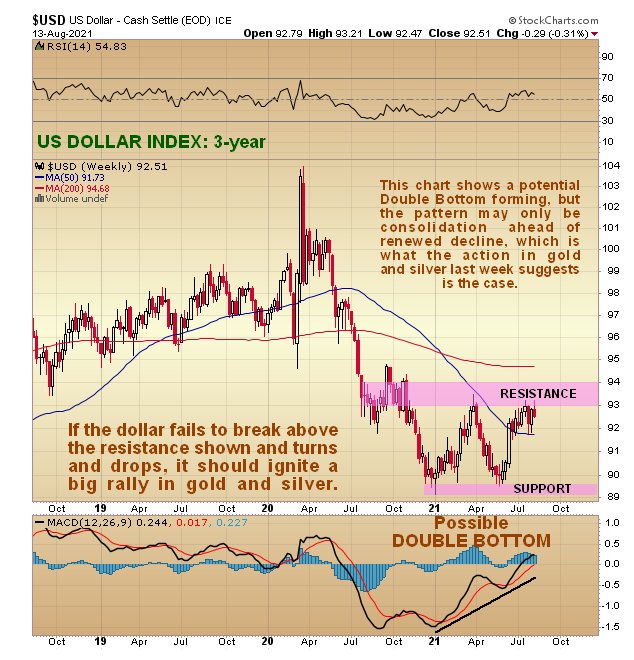
What about the dollar – could it “throw a spanner in the works?” We have already observed that a potential Double Bottom is forming in the dollar index, but the pattern could simply be a zone of consolidation ahead of renewed decline – for us to become more concerned about a significant dollar rally it would have to break above the resistance right above where it is now – and it might not fare better at that than Joe Biden trying to climb the steps of an aircraft.


<< Previous
Bullboard Posts
Next >>

USER FEEDBACK SURVEY ×

Be the voice that helps shape the content on site!

At Stockhouse, we’re committed to delivering content that matters to you. Your insights are key in shaping our strategy. Take a few minutes to share your feedback and help influence what you see on our site!

The Market Online in partnership with Stockhouse