Join today and have your say! It’s FREE!

Become a member today, It's free!

We will not release or resell your information to third parties without your permission.
Please Try Again
{{ error }}
By providing my email, I consent to receiving investment related electronic messages from Stockhouse.

or

Sign In

Please Try Again
{{ error }}
Password Hint : {{passwordHint}}
Forgot Password?

or

Please Try Again {{ error }}

Send my password

SUCCESS
An email was sent with password retrieval instructions. Please go to the link in the email message to retrieve your password.

Become a member today, It's free!

We will not release or resell your information to third parties without your permission.

Quipt Home Medical Corp T.QIPT

Alternate Symbol(s):  QIPT

Quipt Home Medical Corp. is a home medical equipment provider. The Company specializes in improving the home management of chronic illness through the application of telehealth systems and automated distribution. It provides in-home monitoring and disease management services, including end-to-end respiratory solutions for patients in the United States. It offers nebulizers, oxygen concentrators, continuous positive airway pressure (CPAP) and Bilevel Positive Airway Pressure (BiPAP) units; traditional and non-traditional medical respiratory equipment and services, and non-invasive ventilation equipment, supplies, and services. The Company's product offerings include the management of several chronic disease states focusing on patients with heart or pulmonary disease, sleep disorders, reduced mobility, and other chronic health conditions. Its products and services consist of sleep apnea and pap treatment, home ventilation, daily and ambulatory aides, and respiratory equipment rental.


TSX:QIPT - Post by User

Bullboard Posts
Comment by alphabeta1on Jan 09, 2015 2:48pm
177 Views
Post# 23303227

RE:RE:Does anyone see an ascending triangle?

RE:RE:Does anyone see an ascending triangle?

From Investopedia


https://www.investopedia.com/university/charts/charts5.asp

symmetrical triangle 
The symmetrical triangle is mainly considered to be a continuation pattern that signals a period of consolidation in a trend followed by a resumption of the prior trend. It is formed by the convergence of a descending resistance line and an ascending support line. The two trendlines in the formation of this triangle should have a similar slope converging at a point known as the apex. The price of the security will bounce between these trendlines, towards the apex, and typically breakout in the direction of the prior trend. 

If preceded by a downward trend, the focus should be on a break below the ascending support line. If preceded by an upward trend, look for a break above the descending resistance line. However, this pattern doesn't always lead to a continuation of the previous trend. A break in the opposite direction of the prior trend should signal the formation of a new trend. 
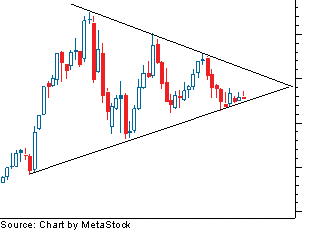
 

Figure 1: Symmetrical triangle

Above is an example of a symmetrical triangle that is preceded by an upward trend. The first part of this pattern is the creation of a high in the upward trend, which is followed by a sell-off to a low. The price then moves to another high that is lower than the first high and again sells off to a low, which is higher than the previous low. At this point the trendlines can be drawn, which creates the apex. The price will continue to move between these lines until breakout. 

The pattern is complete when the price breaks out of the triangle - look for an increase in volume in the direction of the breakout. This pattern is also susceptible to a return to the previous support or resistance line that it just broke through, so make sure to watch for this level to hold if it does indeed break out. 
Bullboard Posts