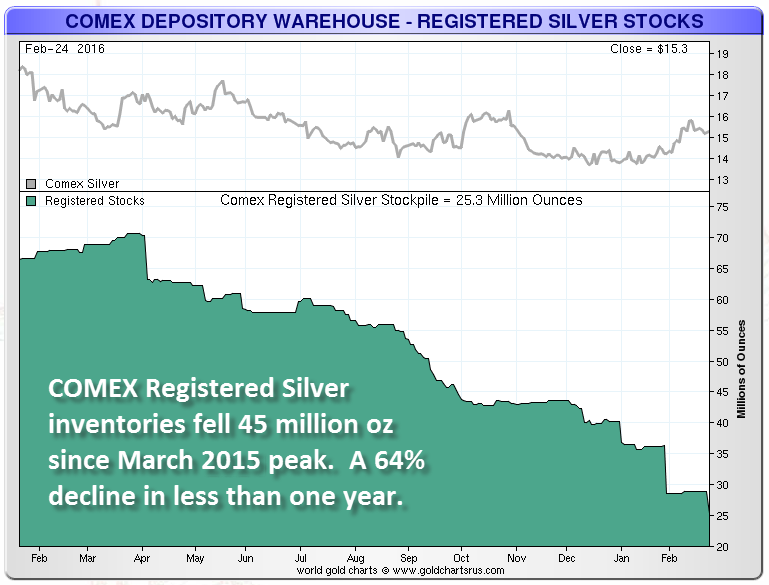
Why price will slowly comes up over the next yearBecause of below graph, demand/Capacity ratio getting higher with worldwide inventory going down, we will see higher price. This is simple economy 101 rules.
glta
What is interesting about this chart is the rapid decline of Registered Silver Inventories over the past year compared to the down trend from 2008 to 2011. From the beginning of 2008, the Registered Silver inventories fell from 90+ Moz to 26.7 Moz in July 2011. Thus, the total decline was 64 Moz over this 3 1/2 year period, averaging out to be 18.3 Moz decline per year.

Now compare that to the 45 Moz decline starting at the peak in March, 2015 (70.3 Moz). This was a huge 45 Moz decline in less than a year… almost three times the decline rate compared to the 2008-2011 period.