Data Acquisition
3D surveys are acquired by laying out energy source points and receiver points in a grid over the area to be surveyed. The receiver points – to record the reflected vibrations from the source points – are laid down in parallel lines (receiver lines), and the source points are laid out in parallel lines that are approximately perpendicular to the receiver lines. The spacing of the source and receiver points is determined by the design and objectives of the survey. They may be several hundred feet apart, or as close as 200 feet.
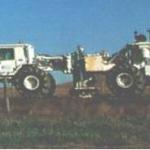
In on-shore data acquisition the energy source for a seismic survey is either Vibroseis or an explosive charge, generally some form of dynamite or an explosive product called primacord. A Vibroseis truck has a large metal plate under the center of the truck body that is lowered onto the ground so that the entire weight of the truck is on the plate. The plate is then caused to vibrate at a specified power and frequency, creating seismic waves that travel into the ground. A single vibrator truck can generate more than 40,000 pounds of ground force, and usually four or five trucks are clustered together to create the energy at each source point, creating a combined ground force of 150,000 to 200,000 pounds.

A Vibroseis Truck
If the energy souce is an explosive charge, the charge is usually set of in a hole between 10 and 150 feet deep, drilled for that purpose. Hole depths rarely exceed 80 feet. The charge is a specified number of pounds of explosive – from 2 to 50 pounds, depending on the depth of the hole.
The area covered by the 3D grid must be larger than the subsurface area to be imaged, in order to acquire sufficient data for the area of interest. Generally, in order to acquire “full-fold data for an area, souce and receiver points must be laid one-half to one mile beyond the boundary of the area of interest. The additional data acquired in this “halo” on the outer edge of a 3-D survey is sometimes called “tails.” If, therefore, a landowner’s property is on the outer edge of a 3D survey, the permitting of his land as part of the survey will not be for the purpose of exploring the subsurface of his property, but for the purpose of acquiring a “full-fold” image of the adjacent property nearer the center of the survey. The quality of the subsurface data at the edge of the survey will not ordinarily be sufficient to map and evaluate the subsurface of these “tail” areas.
3D surveys must be conducted over a large area in order to provide sufficient data for accurate interpration of the subsurface gdology. 3D surveys commonly cover 50 to 100 square miles or more. 3D surveys conducted at different times and covering different but adjacent areas can later be combined into a single data set for processing and analysis, provided there is sufficient overlap of the areas covered by the two surveys.
Data Processing
The data recorded from a seismic survey is originally in its “raw” or “unprocessed” form. Before it can be used it must go through a series of computerized processes. These processes – filtering, stacking, migrating and other computer analysis, make the data useable and require powerful computers and sophisticated computer programs. As computers have become more powerful and processing techniques more sophisticated, it has become common to re-process seismic data acquired in earlier years, creating new opportunities for exploration that could not originally be derived from the 3D data. Processing of data can be very expensive and time-consuming, depending on the size of the area surveyed and the amount of data acquire. Processing of data from one 3D survey may take six months or more and cost hundreds of thousands of dollars.
Data Interpretation
Finally, the resulting processed data must be interpreted by the geophysicist or geologist. All seismic data is subject o interpretation, and no two experts will interpret data identically. Geology is still a subjective science. Although dry holes have been greatly reduced by 3D seismic technology, they have not been eliminated. The proper interpretation of 3D data is a critical step in the process.