For purposes of this write-up on Linamar Corp., we will refer to shares of "LNR," which trades on the Toronto Stock Exchange, or TSX. An ADR is available under the symbol OTCPK:LIMAF for U.S. investors that do not have access to the TSX. Please note the foreign exchange risk associated with investing in ADR securities that is not considered in the LNR fundamental analysis. If the Canadian dollar weakens relative to the U.S. dollar, the ADR’s will lose value in U.S. dollar terms. All dollars throughout this report are in Canadian dollars unless otherwise stated.
Investment Thesis
Linamar is a high-quality auto OEM exhibiting durable competitive advantages, such as high customer switching costs with long-term relationships, and a global manufacturing presence helping maintain high returns on invested capital throughout the full auto-cycle. The company should benefit from secular industry tailwinds through further outsourcing of propulsion systems and gaining market share as hybrid and electric vehicles become more prevalent, combined with acquisition opportunities potentially driving double-digit company growth despite low single digit global vehicle production over the long run. Additionally, management has a strong track record with a second-generation family chief executive having significant insider ownership aligning interests with shareholders. Valuation multiples are at historic lows, when considering intermediate term growth outlook/opportunities, providing a strong long-term investment opportunity.
Company Background
Headquartered near Toronto, Canada, Linamar was founded as a one-man machine shop by Frank J. Hasenfratz in 1966 after immigrating from Hungary. It is now a global diversified manufacturing company that engineers and manufactures powertrain and driveline components for automotive original equipment manufacturers (OEMs) by utilizing precision machining, casting, and forging technology. Linamar employs nearly 26,000 people across 59 plants in 17 countries.
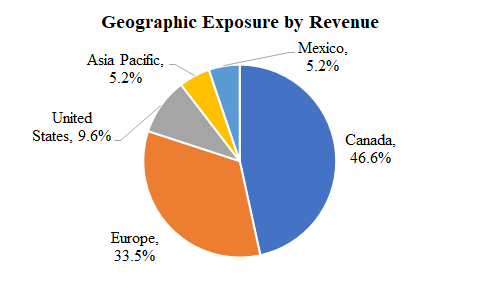
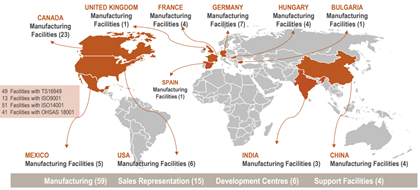
Source: Factset Research Systems Inc., Company Investor Presentation
Core Capabilities & Products
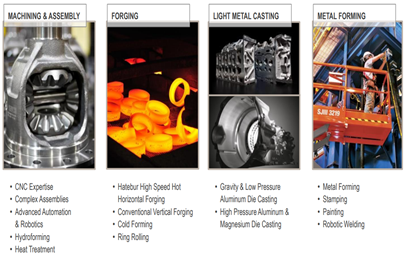
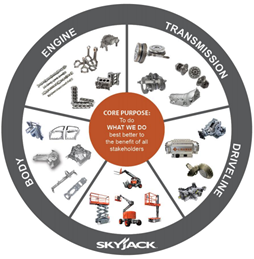
Source: Company Investor Presentation
Linamar has two operating segments: Powertrain & Driveline and Industrial.
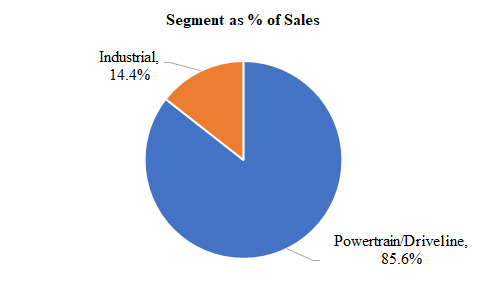
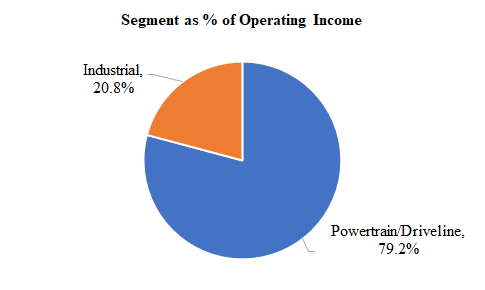
Source: Factset Research Systems Inc.
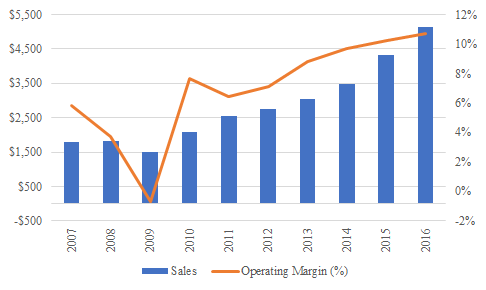
The Powertrain and Driveline segment is made up of machining and assembly, forging, and light metal castings which manufacture products primarily comprised of engine, transmission, driveline, and body components for global vehicle and power generation markets. Linamar focuses on providing light weighting, fuel efficiency, and noise reducing products to customers.
Products as % of Total Sales

Segment Sales and Operating Margins
Source: Factset Research Systems Inc., Company Investor Presentation.
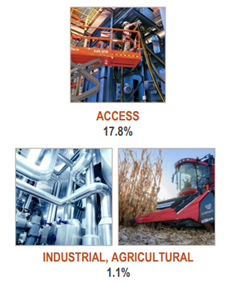
The Industrial segment designs and produces aerial work platforms and telehandlers under the Skyjack brand. It was purchased in 2001 for $37 million and is on track to have operating earnings of $150 million in 2017.
Products as % of Total Sales
Segment Sales and Operating Margins
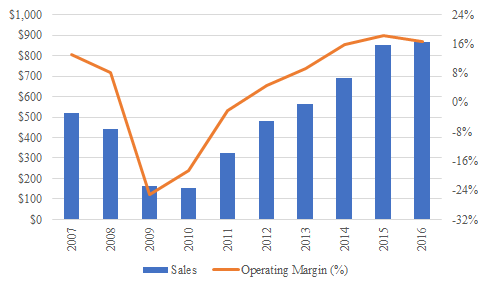
Source: Factset Research Systems Inc., Company Investor Presentation.
Management and Ownership
The current CEO, Linda Hasenfratz, is 50 years old and joined Linamar in 1990, working in many different roles throughout the company, including running a machine, engineering, and operations management. She became CEO in 2002, taking over for her father, Frank Hasenfratz, who started the company in 1966, and remains Chairman of the Board.
Frank Hasenfratz owns ~19.2M shares or 23% of outstanding shares, and Linda Hasenfratz owns 4m shares, or 6% of outstanding shares. In total, insiders own ~30% of outstanding shares.
Competitive Advantage
The auto industry is notorious for cyclical changes in demand dependent on global vehicle production. The final auto manufacturers typically have few competitive advantages as competition between the established companies is intense with barriers to entry declining, minimal customer captivity, and capital-intensive operations providing low returns as demand can fluctuate quickly throughout cyclical declines. These economic characteristics create low expectations and a lot of uncertainty as reflected by the lower multiples that the auto manufacturers currently trade following an eight-year auto recovery.
Alternatively, certain auto OEMs that supply products to the manufacturers can have stronger competitive advantages, providing higher returns on average, throughout the full auto-cycle. Their customers, typically tier 1 OEMS or the auto manufacturers, have high switching costs, resulting from 5-10 year production life cycles tied to contractual agreements, integrated processes, and long-term customer relationships. Several auto components are critical to the final product providing quality risk of switching to a new supplier. As the large auto manufacturers further operate on a global playing field, scale advantages continue to benefit established auto OEMs as potential smaller competitors do not have the unit volumes to justify investing in the high fixed costs such as R&D and facilities to the same degree as the established players. That said, despite certain auto OEM competitive advantages, declines in industry demand will negatively impact operations throughout the auto supply chain. However, it is possible for these players to earn above average returns throughout the entire cycle.
Over the last decade, Linamar has benefited from gaining market share among competitors as well as secular industry tailwinds, providing greater than average industry growth. While light vehicle production has grown at ~3% CAGR from 2000 to 2016, Linamar has been able to grow sales per share at a 10% CAGR.
Historical and Projected Global Light Vehicle Production
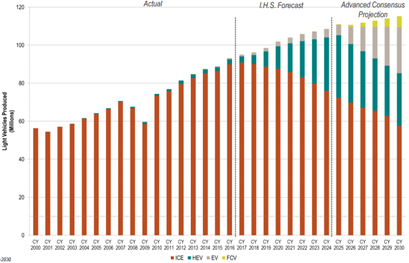
- Internal Combustion Engines ((ICE))
- Hybrid Electric Vehicles (HEV)
- Electric Vehicles ((EV))
- Fuel Cell Vehicles (FCV)
Source: 2017 Investor Presentation, I.H.S. Forecasting 2000-2024
The global powertrain/driveline market is expected to grow at a 5% CAGR through 2020 despite Bloomberg forecasting only a 1.8% CAGR in global vehicle production over the next 25 years. Industry growth is primarily attributable to two long-term secular industry trends which should continue to directly benefit underlying demand: a shift from internal combustion engines ((ICE)) to hybrid electric vehicles (HEV) and Electric Vehicles ((EV)) and further outsourcing of propulsion systems (powertrains).
The majority of powertrains are manufactured inhouse (~70%), but as vehicles shift toward (HEV) and ((EV)) and become more complex/technical in nature, outsourcing of powertrains is expected to outgrow global vehicle production, directly benefiting Linamar and other established companies. Propulsion outsourcing has steadily increased from 15% of addressable content per vehicle in the 1990s, to 32% in 2010s, and is expected to exceed 50% in the 2020s.


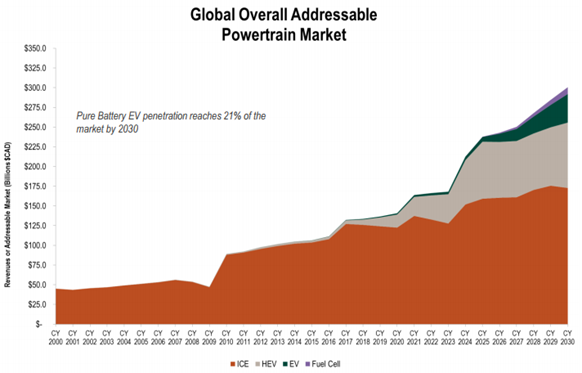
Source: 2017 Investor Presentation
Growth and Fundamentals
Growth
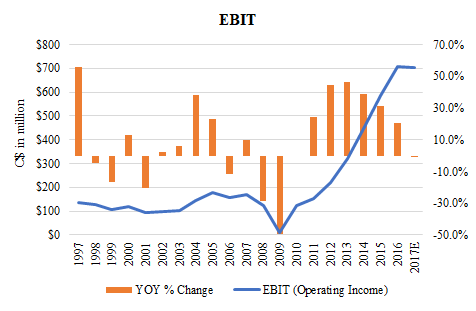
With companies operating in a cyclical industry such as automotive and industrial end-markets, it’s important to review operations throughout the entire cycle. For example, during the Great Recession when automobile unit sales declined in 2008 and 2009, Linamar’s sales fell 2% and 26%, respectively. Since the 2009 trough, sales have grown at an 18% CAGR, while EBIT and EPS grew at a respective 28% and 29% CAGR.
Prior to the downturn, sales peaked in 2007 and have grown at an 11% CAGR over the last 10 years, while EBIT and EPS have grown at a respective 15% and 18% CAGR, outpacing mid-single digit average industry growth, largely attributable to increase in market share through organic growth as well as acquisition opportunities.
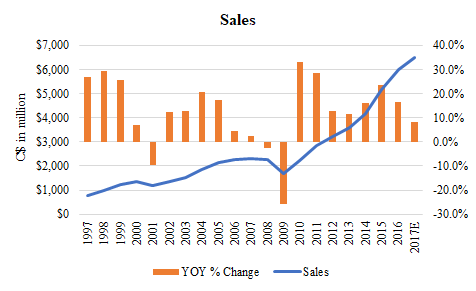
Source: Factset Research Systems Inc.
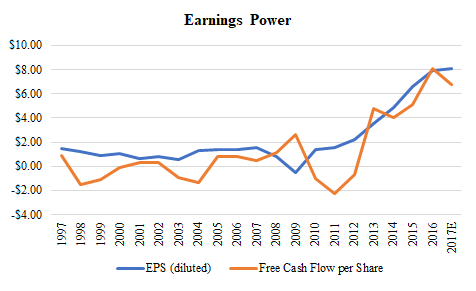
Unlike other capital-intensive companies, EPS is a good proxy for value, with growth in FCF/share tracking closely to EPS.
Source: Factset Research Systems Inc.
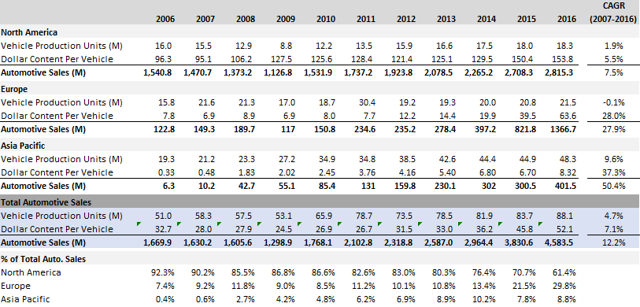
Linamar reports automotive sales and dollar content per vehicle for its three geographic segments: North America, Europe, and Asia Pacific. As the chart shows below and explained in the prior section, despite slower unit production volumes, Linamar has been able to increase its dollar content per vehicles, supporting above average industry growth.
Since the prior peak year 2007, Linamar's auto unit production growth has only been 4.7% CAGR, reflecting a lackluster 1.9% CAGR in North America, flat CAGR in Europe, and somewhat stronger 9.6% CAGR in Asia Pacific although off a smaller base. However, total dollar content per vehicle increased 7.1%, providing total automotive sales growth of 12.2% during the period. Asia Pacific has grown total auto sales at a 50% CAGR off a low base in 2006, but now makes up nearly 9% of total automotive sales.
Source: Company filings
While Linamar has essentially made 19 acquisitions since 1998, the most significant was Montupet SA in February 2016 for a transaction value of US$955 million in cash. Montupet was part of Linamar’s strategy to vertically integrate to increase flexibility, technology, and quality in priority product categories.
Montupet is located in France and manufactures cast aluminum components such as cylinder heads, blocks, induction pipes for the automotive industry. It had sales of $575 million, EBITDA of $108 million, providing a transaction multiple of 8x-9x EBITDA.
Historical Acquisitions (US$ in million)
Source: Factset Research Systems Inc.
Solid margins averaged throughout the cycle
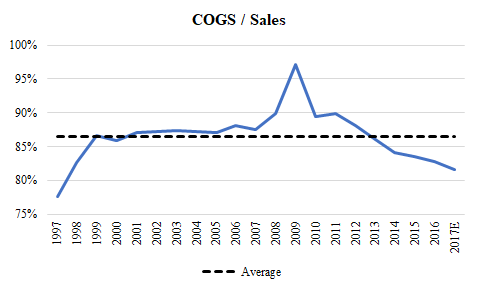
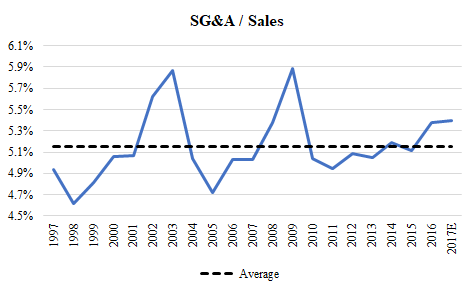
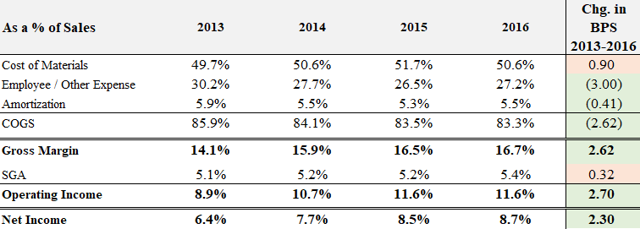
While margins can vary at different points throughout the auto cycle as production volumes fluctuate, Linamar has focused on improving gross margins primarily through lower employee/other variable expenses as a percent of sales (-300 bps since 2013). SG&A expenses make up less of total sales (~5%-6%) vs. COGS (~83%-86%) but have increased a modest 32 bps since 2013.
Note that Montupet was acquired in February 2016, making up ~11% of legacy Linamar sales. Montupet’s historic COGS/sales were lower at 43% of sales vs. Linamar’s 84%, and SG&A was higher at 23% of sales vs. Linamar’s 5%, impacting margins in 2016.
Margins Analysis (2013-2016)
Source: Factset Research Systems Inc., Company filings
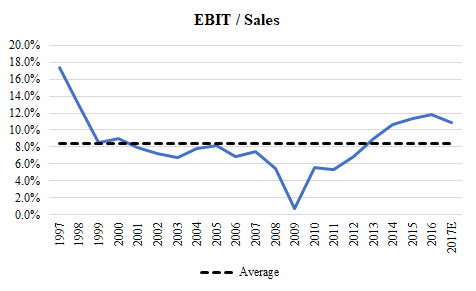
Control of operating costs has provided an average operating margin of 8% over the last 20 years, and 11% over the last five years above the industry average of ~9% in 2016.
Source: Factset Research Systems Inc.
Returns on capital
Return on tangible invested capital measures the tangible capital required to produce operating income, while return on total invested capital measures adequacy of returns on historic investments, such as past acquisitions reflected as intangibles on the balance sheet. Generally speaking, returns on invested capital >20+% before tax, for a long period indicates a company has a competitive advantage.
We view returns on tangible invested capital as the best measure for evaluating operating performance and business quality. While return on equity are the returns shareholders should receive over time, companies can manipulate ROE easier than EBIT/Invested Capital through leverage, tax strategies, etc.
Improving operating margins consequently provided an EBIT/Invested Capital of 20% over the last five years and an average of 13% since 2002. EBIT/tangible invested capital has averaged 22% over the last five years and 14% since 2002.
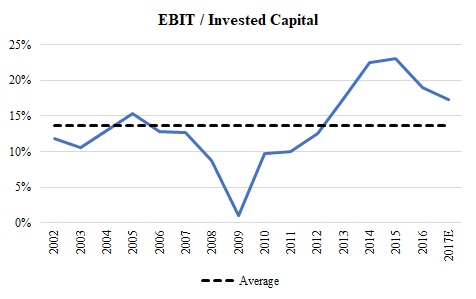
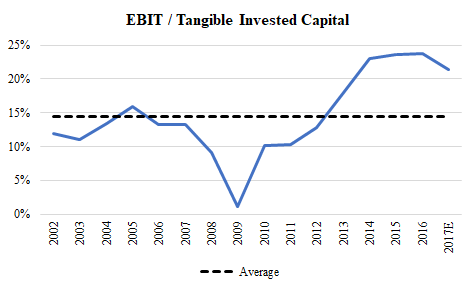
Note: Return on Invested Capital = Adj. EBIT/(total assets – cash - non-interest bearing liabilities). Return on Tangible Invested Capital = Adj. EBIT/(total assets – cash – intangible assets - non-interest bearing liabilities)
Source: Factset Research Systems Inc., Company filings
Since 2002, average returns on tangible equity were 15% and approached 30% in recent years primarily from margin expansion. While margin expansion can partially be attributable to increasing auto production volumes since 2009, company specific initiatives have also benefited operations. During the last cyclical peak in 2007, net margins only reached 4.7% and have since increased to 8.7% in 2016.
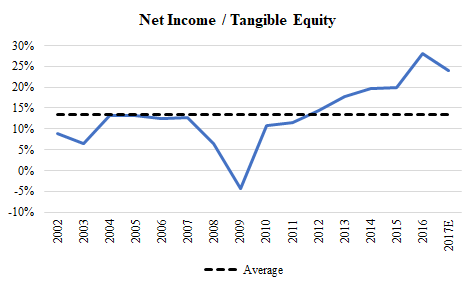
Dupont Analysis

Source: Factset Research Systems Inc.
Capital Allocation
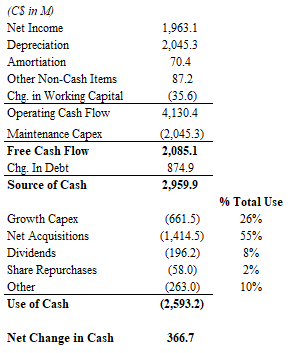
Over the last 10 years, Linamar has generated over $2 billion in free cash flow, assuming maintenance capex equals depreciation expenses. Of the total free cash available, over 26% was allocated towards growth capex, 55% ($1.4 billion) towards acquisitions, most notably, the $1 billion Montupet acquisition and 10% returned to shareholders through dividends and share repurchases.
Total Cash Flow From 2007 To 2016
Source: Factset Research Systems Inc.
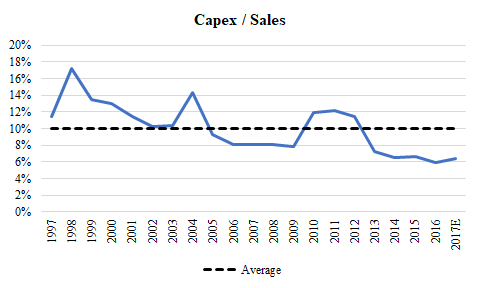
Over the last 20 years, Linamar has become a less capital-intensive business, with capex only averaging 6-7% of sales over the last five years. Lower capital requirement provides more capital to fund growth, potential acquisitions, or increased return of capital to shareholders.
Source: Factset Research Systems Inc.
Auto OEM Industry
The auto OEM industry is dominated by a few large players, with market share among competitors fairly stable. 10-year historical sales and EPS growth is used to evaluate industry growth, covering 2007-2016 which incorporates peak levels prior to the Great Recession, while the sales growth outlook utilizes consensus estimates over the next three years. Certain companies provide different products to the auto supply chain with Delphi Automotive (DLPH), Magna International (MGA), Lear Corporation (LEA), and BorgWarner Inc. (BWA) directly competing in powertrain products.

Source: Factset Research Systems Inc.
Note: Averages exclude LNR and LNR market cap, sales, and EBIT are in C$.
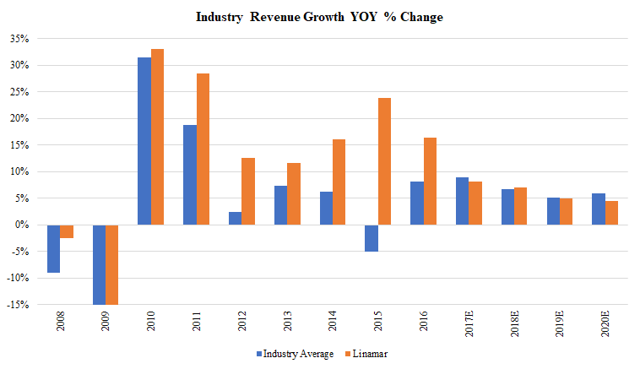
Linamar has outpaced industry growth over the last 10 years, growing at a 10% CAGR vs. the 4% industry average. According to FactSet estimates, industry growth is expected to grow at a 6% CAGR through 2020.
Note: Data includes DLPH, MGA, LEA, BWA, ALV, GNTX, DAN, LNR, TEN, MTOR, AXL
Source: Factset Research Systems Inc.
While certain companies provide different products to Tier 1 auto OEMs and the auto manufacturers, overall market share among competitors has remained fairly stable, which often reflects customer captivity and barriers to entry within the industry. Despite stickier customer relationships and somewhat stable market share, Linamar was one of the few companies to gain share in recent years, growing from ~3% to 5% of the auto-OEM market, note they hold a much large share in their specific product categories.
Industry Market Share (by sales)

Source: FactSet Research Systems Inc.
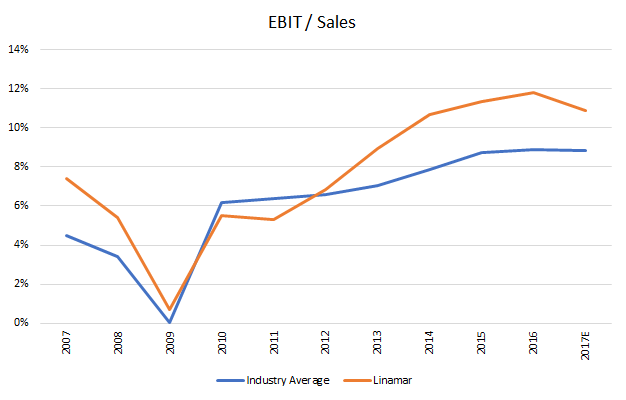
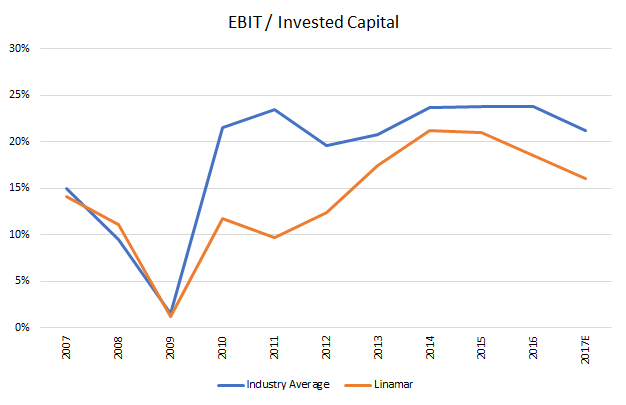
Linamar’s operating margins (EBIT/sales) have historically been in line or exceeded industry peers. In recent years, lower COGS/sales have led operating margins to increase above industry averages by 200-300 bps. While operating margins have expanded, returns on invested capital (EBIT/invested capital) have been below industry average. On an absolute basis, returns on capital are still strong but fall slightly behind peers largely due to slightly lower asset turnover (revenue/assets).
Note: Data includes MGA, LEA, BWA, ALV, GNTX, DAN, LNR, TEN, AXL
Source: Factset Research Systems Inc.
Risks, Outlook, and Valuation
Risks
- Industry Cyclicality: Following an eight-year auto recovery, declines in global vehicle production would negatively impact margins and profitability. Slower organic growth if capacity utilization were to drop.
- Acquisition risk: Montupet was the largest acquisition in Linamar’s history. Any integration issues could negatively impact expected profitability or assumed synergies.
- Foreign Exchange: The majority of operations occur in Canada denominated in Canadian dollars; however global operations outside Canada incur foreign exchange risk when earnings and assets not denominated in Canadian dollars convert values to the local currency. Additionally, shares are traded on the Toronto Stock Exchange valued in Canadian dollars providing currency risk to shareholders with a primary currency not in Canadian dollars.
3Q17 Results
Shares fell ~17% following the 3Q17 earnings report as a result of weak headline numbers with operating earnings and EPS falling a respective 13.5% and 12.9%; however, figures were impacted by several one-time items such as foreign exchange, a net recovery related to the premature termination of a customer contract, and a non-recurring future tax rate reduction on deferred taxes during the prior reporting period. Adjusting for these one-time items, management indicated operating income and EPS would have increased a respective 3.7% and 9.4% year over year.
Total sales growth during the quarter was fairly solid at +6.5%, despite a 7.7% decline in North American vehicle production units. Softness in North America production was offset by 6.9% growth in content per vehicle in the region as well as launching of new programs in European and Asia Pacific markets.
Outlook/Guidance
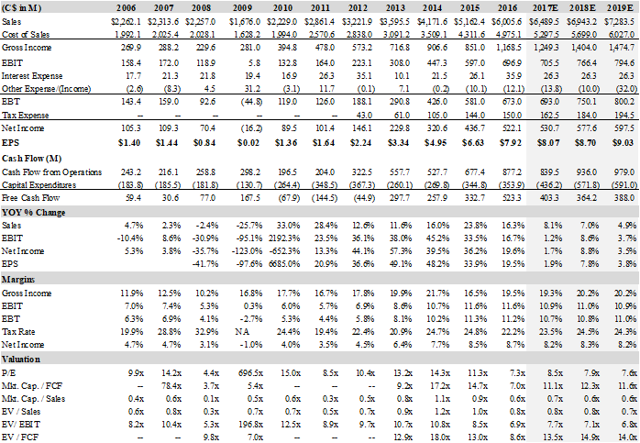
Below are financial projections through 2019 based on consensus estimates as of 11/21/17. With only one quarter left in 2017, it provides general market expectations for sales and earnings growth over the next two years.
Based on current backlog figures, management expects sales to reach $7.75-8.25 billion by 2021, providing a mid to high single digit CAGR, despite its expectations for flat to declining vehicle production. Consensus estimates expect 8% growth in 2017, 7% in 2018, and 5% in 2019.
Consensus EBIT is only expected to grow mid-single digits, with 1% growth this year, 9% in 2018, and 4% in 2019, with stable gross profit margins that are slightly offset by lower operating margins, reflecting lower margins from new programs in the early stages of launch vs. declines in higher margin mature programs. Note new programs have lower margins at the beginning of their life until unit production ramps up.
Management indicated adjusted net earnings growth for the year in the high single digit to low double-digit range in 2017, with double digit EPS growth in 2018, with net margins ranging between 8.0-8.5%. The eight analyst estimates included in consensus expectations have a more cautious outlook of Linamar’s near-term outlook with EPS growth of only 7% in 2018 and only 3.8% in 2019, likely reflecting the view that North American auto unit production levels will continue to deteriorate vs. management expectations for flat light vehicle production growth.
Linamar forecasts expect global light vehicle production to decline in light vehicles volumes for this year to 17.3 million vehicles in North America (-5%), moderate growth in Europe to 22.3 million vehicles (+4%) and modest growth in Asia to 49.7 million vehicles (+3%). In 2018, light vehicle production is expected to be flat in all regions globally with growth of 0.2-1.5% depending on region. Despite flat or even down vehicle production, sales should grow mid to high single digits from new business wins as outsourcing of components and systems drive growth and increase content per vehicle.
Source: Company filings, FactSet Research Systems, Inc.
Valuation
Valuation is all about calculating expected future cash a company generates and discounting it at an appropriate rate. With cyclical companies, estimating future cash flows can be challenging, given uncertainty surrounding where we are in the business cycle. While end-market demand rises and falls due to several different factors, if you average the growth over the entire cycle it will provide stable cash flows that can help approximate an appropriate value.
For an example of cyclicality and averaging growth over the cycle, we can look at North American Auto and Light Truck Sales. From 1990 through 2017, annual year-over-year changes have fluctuated between a drop of -36% in 2008 to an annual growth of +12% in 2010. Over the 27-year period, sales have grown from 12.7 million units in 1990 to an estimated 18 million units in 2017, providing a +1.3% CAGR. If you grow 1990 units at 1.3% over the 27-year period, which smoothes out the cycles, the total units sold would be 413 million vs. the actual total 418 million units sold throughout the entire period.
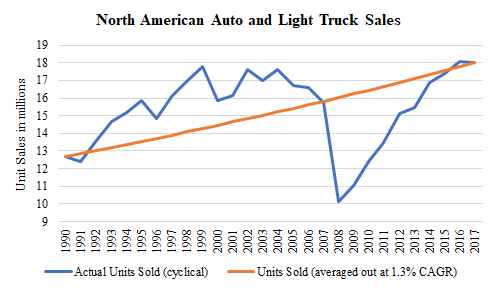
- Actual units sold from 1990-2017: 418.5 million
- Units sold if average growth of 1.3% CAGR: 413 million
Averaging the expected results over an entire cycle can provide a decent proxy for expected total results.
Linamar should be able to grow despite lackluster global vehicle production (Bloomberg estimates 1.8% CAGR over next 25 years) due to increased content per vehicle as well as growth in the industrial segment and end-markets outside of auto. As shown in the chart below and explained earlier, Linamar’s total automotive sales grew 12% from 2007 through 2016, attributable to 5% growth in vehicle production units but more importantly, 7% growth in dollar content per vehicle.

Source: Company filings
Since the last peak in 2007, sales and EBIT grew at a respective 11% and 15% CAGR over the 10-year period through 2017E. Over the last 5 years, with the benefit of industry tailwinds, sales and EBIT grew at a 15% and 30% CAGR. Unlike other capital-intensive companies, Linamar has been able to turn operating income into cash flow, with free cash flow per share growing at a 20% CAGR since peaking in 2006, which largely went towards acquisitions, growth capex, and dividends.
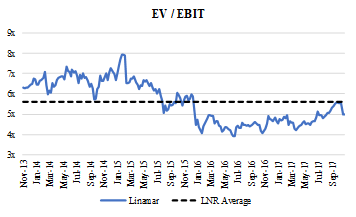
FactSet data only goes back to 2013, providing a historical average EV/EBIT for Linamar of 5.6x, and it is currently trading at only 5.0x EBIT. However, recent years do not provide an adequate average multiple over the full cycle and should be taken lightly, if not opportunistically by providing a conservative valuation multiple. Based on available financial and market data, EV/EBIT ranged between 9x-11x between 2007 and 2012, except in 2009 when there was a large asset impairments negatively impacting EBIT.
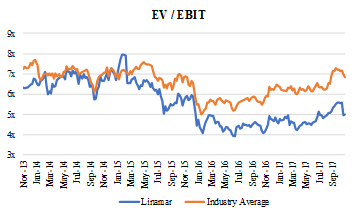
The industry average EV/EBIT since 2013 is 6.5x and is currently trading at 6.8x. Since 2013, Linamar has historically traded at about a 15% discount to peers. However, the discount has increased recently to 30%. The larger auto-OEMs such as Delphi Automotive, BorgWarner, Autoliv (ALV), and Gentex (GNTX) have historically traded at higher multiples, in the 8x-11x range.
 Source: Factset Research Systems Inc.
Note: Industry average includes DLPH, LEA, MGA, BWA, ALV, GNTX, DAN, TEN, MTOR, AXL
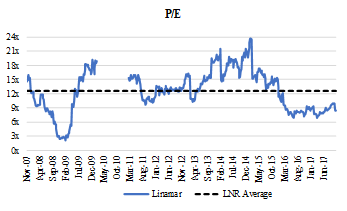
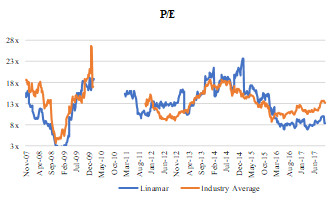
Historical trailing P/E data is available since 2007. Excluding abnormal multiples during 2009 and part of 2010, Linamar has traded at an average P/E multiple of 12.6x and is currently trading at 8.4x earnings. The industry average P/E multiple since 2009 is 13.1x and is currently trading at 13.0x. Linamar is currently trading below both its historical average as well as the industry average P/E multiple.
Source: Factset Research Systems Inc.
Note: Industry average includes DLPH, LEA, MGA, BWA, ALV, GNTX, DAN, TEN, MTOR, AXL
We do not put much weight in long-term future projections. However, it’s good to have a range of the future possible outcomes for a company by looking at its historical results and future opportunities. Looking forward, we use operating earnings or EBIT as the best proxy to estimate earnings power/cash generating ability.
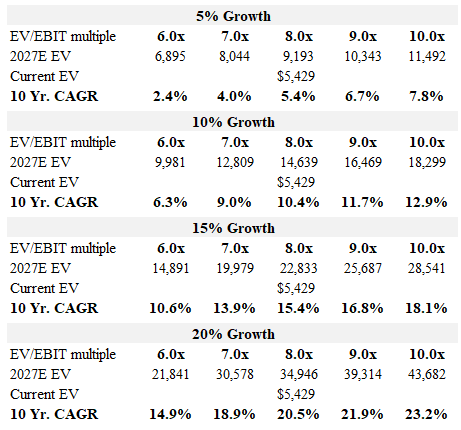
For scenario analysis, utilizing an EV/EBIT provides a decent proxy for expected returns over the next 10 years. Similar to the last 10 years, the next 10 will likely include a cyclical downturn at some point. As explained above, Linamar has been able to reinvest cash flows to grow operating income at a strong rate throughout the entire prior cycle, and the immediate growth outlook based on management expectations is for the high single to low double-digit range. Based on 2017E EBIT, CAGRs of 5-20% were applied over a 10-year period providing a 2027E EBIT.
EBIT Growth

Source: Saga Partners, LLC.
An EV/EBIT multiple was applied to the 2027E EBIT ranging between 6x and 10x. While the average EV/EBIT has only been 5.6x since 2013, the last two years have been historically low multiples, and Linamar’s EV/EBIT has ranged between 6x and 11x since 2009. Recent multiples likely reflect the market’s belief that auto sales have reach their peak and provide little credit to Linamar’s growth opportunities despite slower auto unit production. Multiples will likely reflect where the market thinks we are during the cycle. Therefore, it’s probably best to apply a 2027 multiple somewhere within the average range with 6x EV/EBIT on the low-end and 11x likely too high. The larger, somewhat higher quality auto-OEMs have historically traded at high multiples in the 10x-12x.
Source: Saga Partners, LLC.
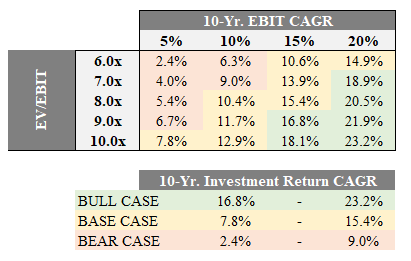
The table below summarizes the results with the bull case incorporating 15-20% EBIT growth and a 9x-10x multiple, base case having 10-15% EBIT growth and 7x-9x multiple, and bear case having 5-10% EBIT growth and 6x-8x multiple.
An EV/EBIT multiple between 8x and 9x would be reasonable during mid-cycle operations. If growth continues at a strong pace over the next 10 years, and the market puts a higher valuation on Linamar’s operating income, it can provide a 10-year investment CAGR of 17%-23%. However, if we go through a sharp downturn and Linamar is not able to grow content per a vehicle as expected providing only mid-single digit EBIT growth on a lower multiple, only a 2-9% 10-year investment CAGR is expected. While the bull case is slightly optimistic scenario, we believe the bear case is also a low probability event and total investment returns will likely lie somewhere in the base case, with our bias towards the higher-end of expectations over the next 10-years (>~15% CAGR), plus a dividend yield of 0.5-1.0% annually.
Expected Investment Return CAGR Scenario Analysis
Source: Saga Partners, LLC.
Conclusion
Linamar is a high-quality auto OEM, managed by a second-generation family CEO with significant insider ownership. It has been able to and should continue to grow throughout the auto cycle despite slower unit sales, benefitting from long-term secular industry tailwinds and potential market share gains. Valuation multiples are below historic averages as well as industry peers, largely reflecting the market’s expectation for slower auto production while Linamar should be able to provide high single digit sales growth even with flat to declining production.
Over the long run, valuations will reflect the growth in earnings, or in our scenario analysis above, operating income. There is a strong probability Linamar can continue to achieve double-digit growth over the next cycle (base case) and deserves a higher multiple as it continues to develop into an global, high-quality, auto OEM providing strong returns on invested capital.