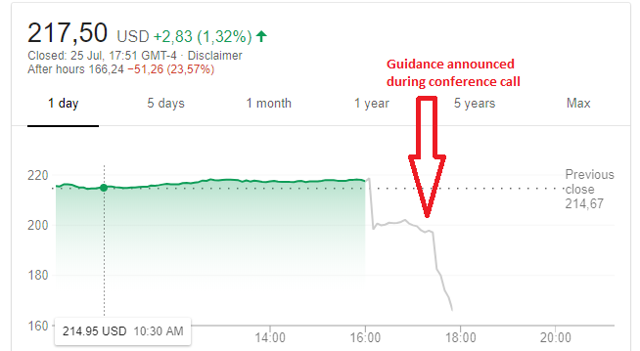
Facebook (FB) market capitalization has shrunk by more than $100B after the management issued a new guidance during the Q2 2018 conference call. This drop comes in addition to an initial 9% drop following the press release announcing the results.
Source: Google finance
The company reported a strong revenue and operating growth for Q2 2018 compared with Q2 2017. However, due to additional investments, margins are being pressured, and the revenue growth will start decelerate.
Users and revenue growth
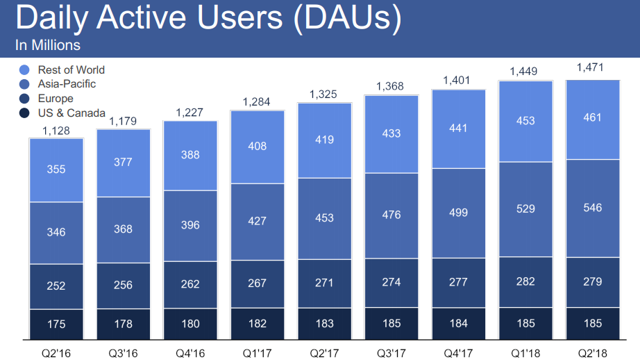
The slide below provides an overview of the Daily Active Users (DAUs), without taking into account Whatsapp and Instagram.
Source: presentation Q2 2018
DAUs amounted to 1.47 billion in June 2018, an 11% increase compared to the year before.
North American DAUs have been stagnating for four quarters in a row while European DAUs have diminished for the first time, compared to last quarter. During the conference call, Mark Zuckerberg cited the GDPR regulations as the main culprit.
Therefore, DAUs growth is supported by Asia and the rest of the world.
The Monthly Active Users (MAUs) evolution follows the same trend as the DAUs. MAUs also increased by 11% to amount to 2.23 billion by June 2018.
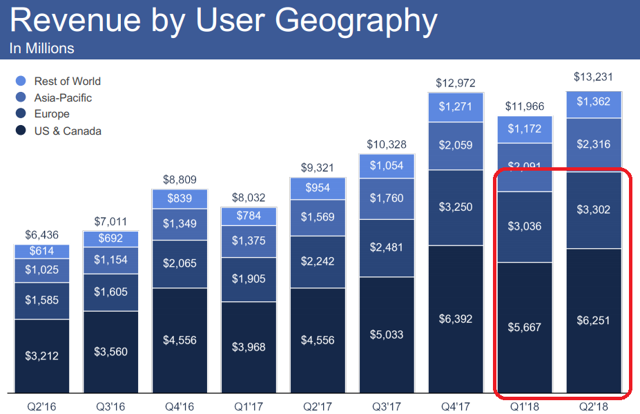
As I have highlighted on the graph below, despite a slight decline of users compared to last quarter in North America and Europe, Facebook managed to generate 10% more revenues from these users.
Source: presentation Q2 2018
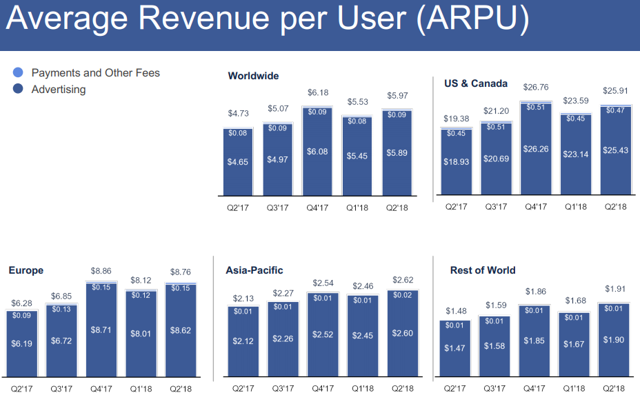
Obviously, the corresponding evolution of ARPU for North America end Europe is reflected in the ARPU diagrams shown below.
Source: presentation Q2 2018
These diagrams highlight the revenue growth potential outside Europe and North America. Even if the ARPU from Asia and the rest of the world would not match North American revenues due to differences in local economies, there is still ample room to grow.
In addition, Facebook can still monetize Messenger and WhatsApp. During the conference call, the management has indicated that the company was in the very early stage to monetize these applications.
For the first time, the company revealed the total number of users for all the applications (Whatsapp, Instagram, Messenger, Facebook) which amounted to 2.5 billion in June 2018. It is not a surprise, but it is still spectacular.
The margin question
While revenues grew at an impressive rate of 42%, total costs and expenses grew faster at 50%. Logically, as shown on the table below, EPS grew "only" by 32%, which is still an impressive result for a company of this size.

Source: press release Q2 2018
The management also indicated a 47% rise of the headcount compared to Q2 2017, partly explaining the lower margins.
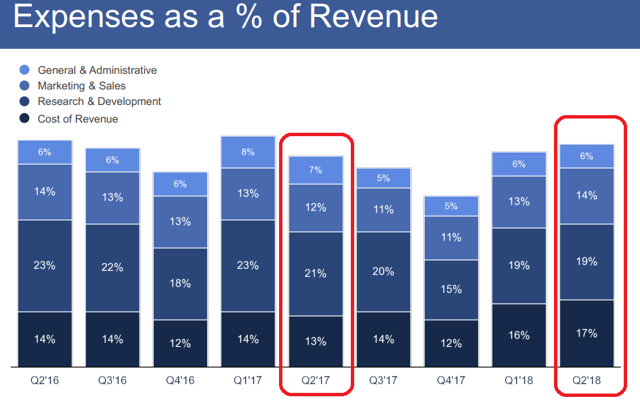
The slide below confirms the evolution of expenses compared to revenues.
Source: presentation Q2 2018
I have highlighted both Q2 2017 and Q2 2018 to show that, despite its bigger scale compared to last year, the company has grown its expenses faster than revenues.
The management explained that these additional expenses by investments in safety, privacy (GDPR), and fake news treatment. These additional costs will persist on the long run.
What about the cash ?
Facebook grew its cash balance to $42.31B despite having spent $3.3B for shares buy backs.
The timing of buy backs is unfortunate as buy backs took place at the highest prices ever, and before the drop following the Q2 2018 results.
The lower free cash flow compared to last year is due to additional investments, mainly in data centers and offices, as shown on the table below.

Source: press release Q2 2018
The $100B guidance
Usually, I don't spend so much time on guidance. However, considering the surprise and the reaction of the market, I make an exception.
The management has announced a deceleration of the growth for the second half of the year due to a mix of three factors:
- Currency headwind.
- Data privacy implementation.
- Investment in "stories" that generate less growth than the Facebook feed.
Therefore, it seems that the H2 revenue growth would represent "only" about 20%, and following this announcement, the market cap lost more than $100B.
In addition, costs would rise by 50-60% in H2 2018.
The management has also indicated that, beyond 2018, expenses are expected to grow more than revenues for an operating margin reaching mid-30% in a couple of years, against 44% this quarter, and 47% last year.
On the capex side, the company will spend $15B in 2018 (mainly for data centers and offices), and more during the years after.
We see here the valuation challenge with high growth companies: by announcing a growth of 20% with mid-30% operating margins, which are still very good figures, the market cap drops by more than 20%.
Valuation
As a result of the shares buy back, the number of diluted shares amount to 2,930 million.
After the close of the market, at the time of writing this article, the share price was down by about 20.8% at $172.26.
Based on the guidance, I estimate the revenues 2018 at $54B and the operating income at $21.6B (with 40% operating margin).
With a tax rate at 15%, net income 2018 would be around $18B.
Considering a 20% revenue growth and a medium term 35% margin, I consider the net income 2019 at about $19B.
I attribute a PER of 20 on my estimation of the the 2019 net income to value Facebook at $19B * 20 + $42.31B (cash balance) = $422B, corresponding to a price of $144/share.
Applying an arbitrary 20% margin of safety, I would buy shares at a price below $115. Therefore, even with a strong reaction, the market seems to overvalue the company, based on a PER of 20.
Conclusion
Facebook has announced good Q2 2018 results despite an erosion of the revenue growth and some pressure on the margins.
The guidance has confirmed this trend. Although revenues will still grow at above 20% and operating margins will stay high at about 35%, the market immediately reacted by lowering the valuation of the company by more than $100B.
However, the price offered by the market is still too high for me to get involved.
Disclosure: I/we have no positions in any stocks mentioned, and no plans to initiate any positions within the next 72 hours.
I wrote this article myself, and it expresses my own opinions. I am not receiving compensation for it (other than from Seeking Alpha). I have no business relationship with any company whose stock is mentioned in this article.