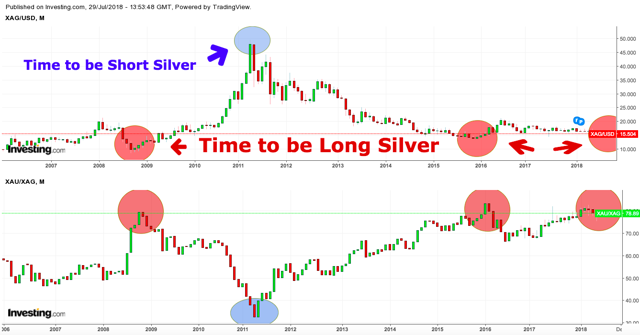
It was April 2011, and Silver was making headlines everywhere as it reached $50 an ounce.
Voracious financial investment demand had been pivotal to Silver's pop that matched levels only seen in 1980, after the Hunt Brothers bought the metal aggressively for seven years, at one time owning 55 million ounces of Silver.
After that correction from 2011 high, apathy abounds. The metal lost its brightness, as it continues to be trapped between support and resistance levels.
Is it a liquidity or a volatility problem? I don't think so. Gold and Silver markets are about as liquid as it gets. Yes, we could say that Gold is the more liquid of the two metals due to its greater demand, as well as supply over Silver. But not the reason of the lack of interest.
I believe the reason why Silver is not getting market participants' attention is because of its reputation of being a manipulated market.
Financial history books remember the 1960s Alan Rosenberg case to the Silver Thursday event on March 27, 1980, following the Hunt Brothers' attempt at cornering the Silver market that led to a panic steep fall in Silver prices.
Since then regulators increased their efforts to avoid these issues, which led to many red flags being raised over the last decade.
From 2010, HSBC and JPMorgan were accused of manipulating the Silver market to the 2016 evidence of collusion among the fixing banks, until last January where the CFTC Filed Anti-Spoofing Enforcement Actions against UBS and others.
Several indicators tracked are telling me that Silver's indifference within the investment community might end up soon.
Market Sentiment is at historic low.
Market sentiment, normally defined as crowd psychology, is the overall attitude of investors toward a particular security or financial market.
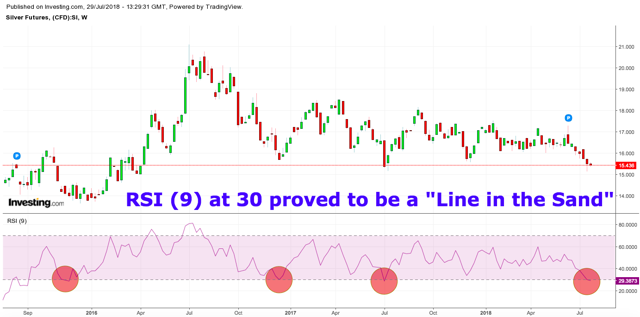
For some markets like Silver, I tend to measure extreme levels on a simple Relative Strength Index.
As per its definition, settings of 70 and 30 are considered standards that serve as clear warnings of overbought and oversold conditions of a particular asset, respectively. It's a visible sign of either an overheated market or one that is oversold.
For Silver historically worked the 9-week weekly period.
Every time it reached the 30 area, it rebounded.
That "magical" 30 figure on Silver was reached last week, again.
image: https://static.seekingalpha.com/uploads/2018/7/29/49629164-15328803136391034.png
Why this is so important?
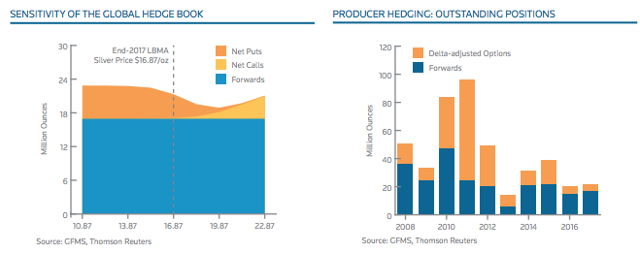
Producers are natural sellers of Silver in the futures markets, as a hedge.
That number can be followed every weekly in the report released by the Commodity Futures Exchange Commission, which tracks the Commitments of Traders.
As per the last report, the Commercial Group, represented by Producers, Merchants, Processors, Users and Swap Dealers form that Commercial Group, started to act in line with what the Relative Strength Index is telling: Increased their long position, reduced the shorts.
image: https://static.seekingalpha.com/uploads/2018/8/2/49629164-15332000188895283.png
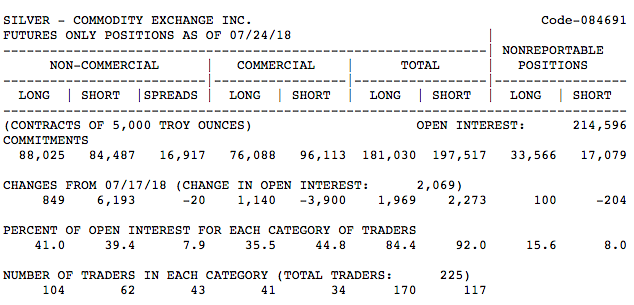
Coincidentally, Silver speculators dropped their bullish net positions for the 6th straight week.
Who do you believe represents "Smart Money" for metals?
I leave that answer to you...
By how they performed in the last few years, I believe the Real Smart Money are the producers, although those are very difficult to track on a weekly basis. As defined in the 2018 World Silver Survey, that group is defined as the Global Producer Hedge Book, which stood at 33.3 Moz (1,036 t) at the end of 2017.
image: https://static.seekingalpha.com/uploads/2018/8/2/49629164-15332023615317132.png
Gold to Silver Ratio looks appealing for Silver.
The Gold to Silver Ratio is actually simple: It's the amount of Silver ounces it takes to purchase one ounce of Gold.
In 1792, the ratio was fixed by law in the United States at 15:1. The average Gold to Silver price ratio during the 20th century was 47:1.
Over the last 25 years, 80:1 area proved to be "A LINE IN THE SAND" and the start of an upward move on Silver.
Silver is consolidating around that 80:1 ratio for several weeks.
Will history repeat itself?
image: https://static.seekingalpha.com/uploads/2018/7/29/49629164-15328803551466033.png
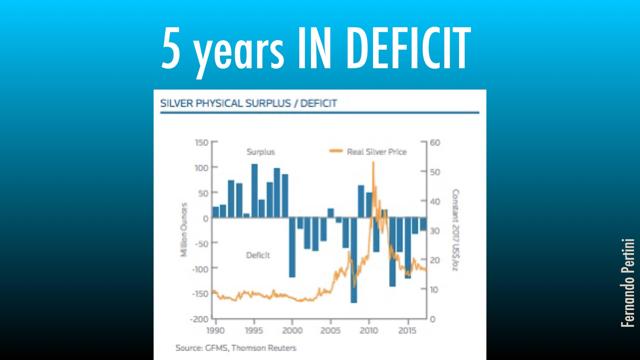
A real world message: Silver is in deficit.
2017 was the 5th year in a row of deficit.
This time of 26.0 Moz (810 t) according to a Reuters publication together with the World Silver Institute.
Why is this deficit so meaningful? Because it happened despite a huge fall recorded from coin and bar investment of 27% to 151.1 Moz (4,699 t) mainly due to the Bitcoin frenzy, which happened during 2017.
That Bitcoin appetite calmed down lately...
image: https://static.seekingalpha.com/uploads/2018/7/29/49629164-15328814950633419.jpeg
Source: World Silver Survey 2018
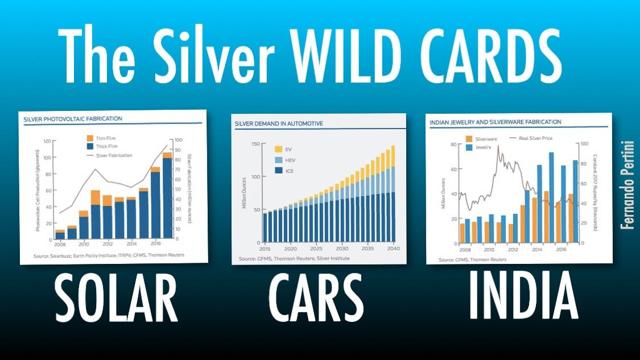
Demand is growing: The Silver wild card.
- Silver demand from the Photovoltaic (PV) industry rose 19% in 2017 to a record high of 94.1 Moz. China grew 46% and accounted for more than half of the world new solar panel installations. A growing trend that looks to be here to stay.
- Silver is increasingly being used in Internal Combustion Engine Vehicles (ICE), Autonomous Vehicles (AV), Electric Vehicles (EV) and even Photovoltaic Applications (PV) that are creating new applications that looks to drive demand in the future.
- Indian Jewelry and Silverware trend remains robust. In 10 years, fabrication grew 4-fold!
image: https://static.seekingalpha.com/uploads/2018/7/29/49629164-15328803960757036.jpeg
Source: World Silver Survey 2018
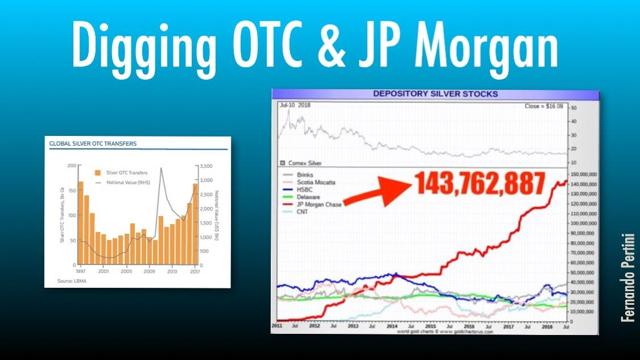
LBMA OTC transfer + massive JPMorgan accumulation.
What's behind those transfers?
Compiling all data suggests that the notional value of Silver transfers increased 29% year on year to approximately $2.8 trillion in 2017, a second consecutive increase, representing way above a CAGR of 6% yearly average since 1997.
That's marking a fifth consecutive year of increases.
What's behind JPMorgan's massive accumulation?
According to many information providers, JPMorgan amassed a gigantic hoard of Physical Silver to become the largest single owner of physical Silver in history.
As of today, it's more than twice as large as what was amassed by the Hunt Brothers back in 1980, when the Hunt Brothers were formally charged and convicted of “cornering the Silver market.”
The answer to that question is still unknown. The end of story is yet to be seen...
image: https://static.seekingalpha.com/uploads/2018/7/29/49629164-15328818171310186.jpeg
Source: World Silver Survey 2018 - ZeroHedge
Last, but not least...
One last chart expresses the beliefs of two of the world's greatest investors and it will help you, as it helped me with my final conclusion.
Warren Buffett's "Be fearful when others are greedy and greedy when others are fearful” and John Templeton's “The time of maximum pessimism is the best time to buy and the time of maximum optimism is the best time to sell.”
image: https://static.seekingalpha.com/uploads/2018/8/2/49629164-1533254642963892.jpeg
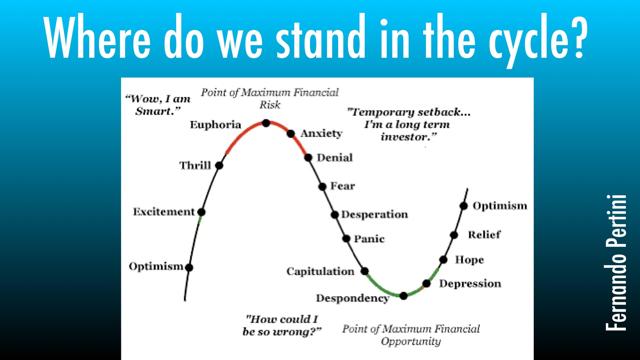
I do believe it's a good time to own some Silver.
Would love to hear your comments and thoughts!