Real interest rates are trending increasingly negative Real Interest Rates and Gold
Generally, real interest rates are negatively correlated with the price of gold, i.e. rising real rates adversely impact the yellow metal. For example, in the article entitled The Golden Dilemma, Claude Erb and Campbell Harvey found very strong negative correlation between real interest rates and gold prices (from 1997 to 2012), to the tune of -0.82 (while -1 means a perfect negative correlation). The reasoning behind this is that higher interest rates mean higher opportunity costs of holding non-interest bearing assets, such as precious metals, making them relatively less attractive. Basically, gold pays neither dividends nor interest. Thus, it is relatively expensive to hold in the portfolio when real interest rates are high, and relatively cheap when real interest rates are low. In other words, the higher the interest rates are, the higher are carrying costs.
However, the relationship is not linear. Gold prices tend to increase significantly only during the periods of negative real interest rates. This is because negative interest rates, i.e. the situation when the inflation rate is higher than the nominal interest rate (the rate which is actually paid), means that creditors are losing money, therefore they are more prone to buy gold, even though it does not bear interest or dividends. In other words, gold then reclaims its traditional role as money and a store of wealth, which will at least keep pace with inflation to preserve the purchasing power of the capital, while bonds guarantee a real loss at negative real interest rates.
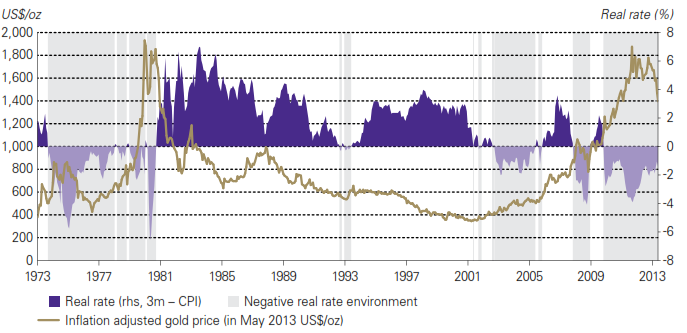
A few historical examples confirm the adverse relationship between real interest rates and gold prices. In the second half of the 1970s, both nominal interest rates and inflation rates were high. What is important, is that inflation exceeded the nominal returns on bonds, therefore investors shifted their capital into gold. While real interest rates were negative, the price of gold rose, reaching its ultimate high. However, as soon as Paul Volcker hiked short-term nominal interest rates and real interest rates came back into positive territory, the gold boom ended. Interestingly, the significant downtrend in the gold market continued until 2001, when the Fed, trying to reinflate a stock bubble, cut nominal interest rates so much that real interest rates fell to zero. As we can see in the graph, the consolidation from mid-2006 was caused by the rise in real interest rates. However, in late 2007 the Fed lowered nominal rates again, and then real rates plummeted and the gold price simultaneously soared.
Chart 1: Real gold prices and real interest rates (as yields on 3-month Treasury bills less CPI inflation) from 1973 to 2013; source: gold.org)

Summing up, changes in real interest rates are crucial to understanding movements in the price of gold. The adverse relationship between real interest rates and the gold price is quite well-established in the literature and was confirmed by a few empirical exercises. The biggest booms in the gold market occurred in negative real rates environments, first during 1970s, when both nominal interest rates and inflation rates were high, and later in 2000s, when both nominal interest rates and inflation rates were low.
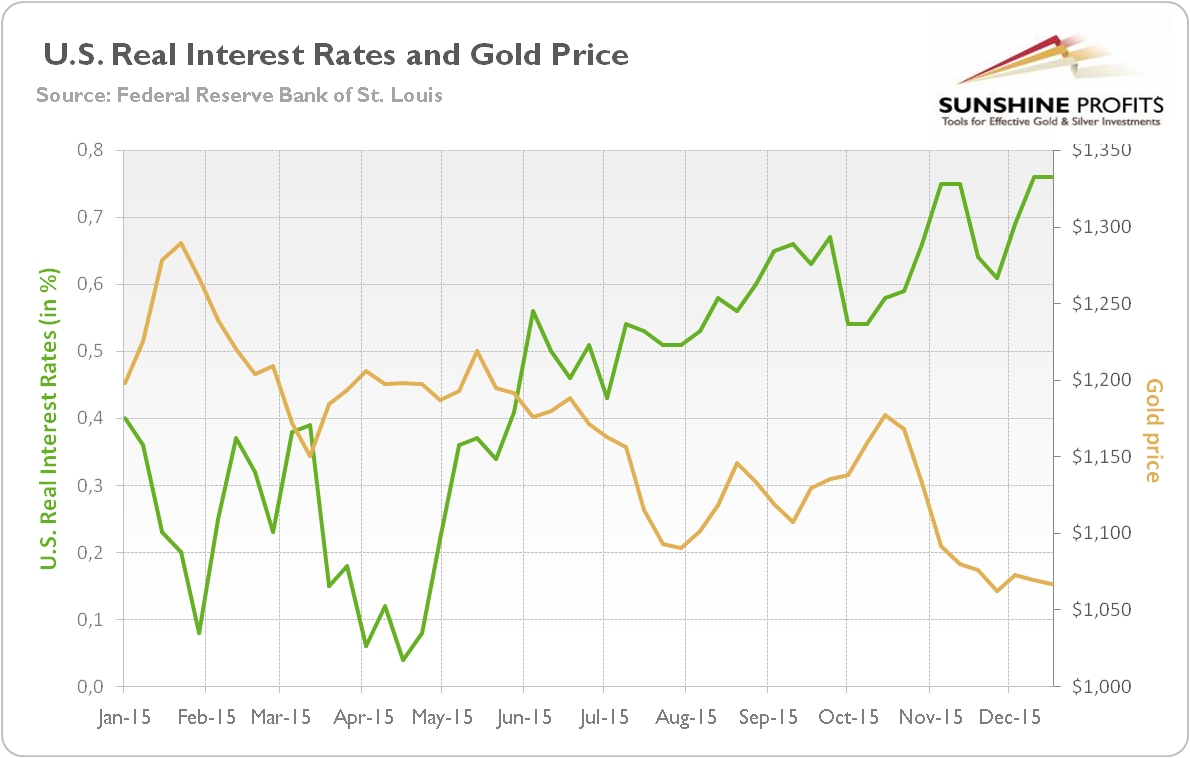
Another example is 2015, when the price of gold fell on the expectations of the Fed hike and the resulting appreciation of the U.S. dollar against major currencies, and on the rise in the U.S. real interest rates (see the chart below).
Chart 2: The price of gold (yellow line, right axis, London PM Fix) and U.S. real interest rates (green line, left axis, yields on 10-year Treasury Inflation-Indexed Security) in 2015.

Negative Real Interest Rates and Gold
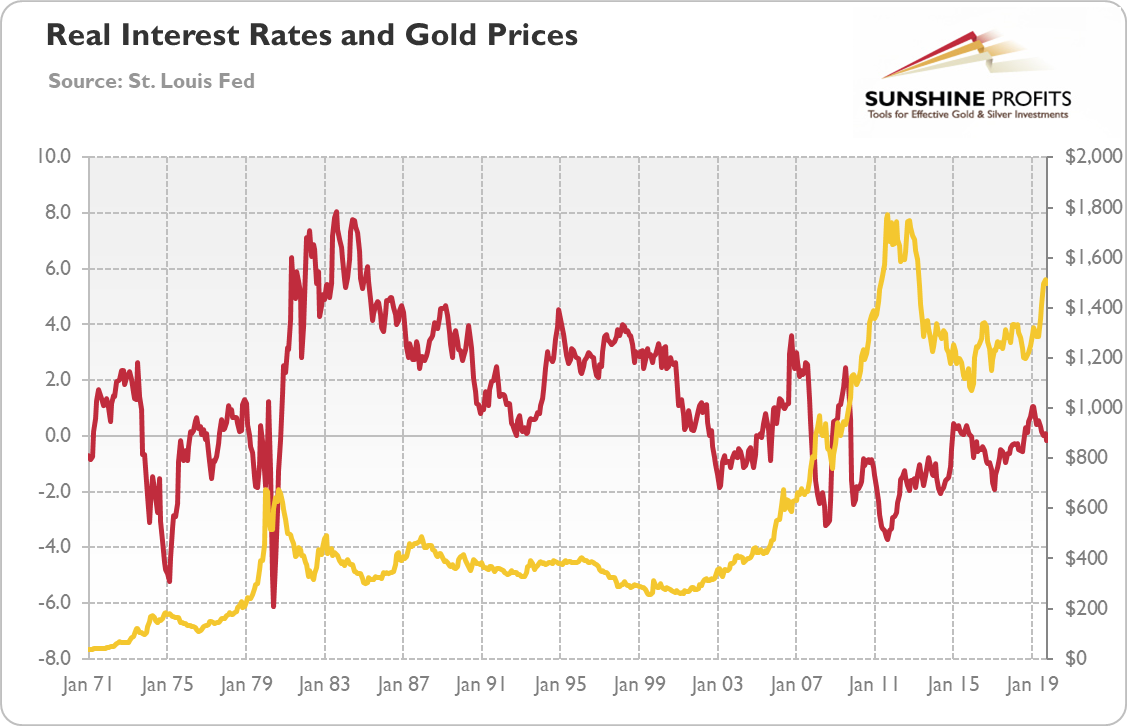
Although gold can gain when real interest rates are moderately positive, the negative real interest rates are one of the most important drivers of the rallies in gold prices. Indeed, let’s look at the chart below, which shows the gold prices and the short-term real interest rates (1-year Treasury rate minus the annual CPI rate).
As one can see, the gold prices rallied in late 1970s and 2000s, when the real interest rates turned negative. Meanwhile, the 1980s and the 1990s were the periods of positive real interest rates, so gold struggled. What is also important to remember is that it’s not only about the level of interest rate, but also about the direction or trend in the real interest rates.
Chart 3: Gold prices (yellow line, right axis, London P.M. Fix, in $) and real interest rates (as yields on 1-year Treasuries less CPI annual inflation; red line, left axis, in %) from January 1971 to October 2019)

In 2019, the real interest rates peaked and started downward trend. They even fell below zero. Then, it can’t be seen as a coincidence, that the gold prices jumped in 2019. At the moment of writing these words in mid-November 2019, the real interest rates are venturing deeper into the negative territory, which would work to put more shine to gold prices. Conversely, if the real rates turn positive, the yellow metal may struggle.